

Britain's private rented sector is held up by roughly 2.82 million landlords, most of whom own a single property and none of whom fit the "accidental millionaire" stereotype that dominates tabloid coverage. This page consolidates the most current, primary-sourced statistics on who UK landlords are, how their portfolios are structured, how profitable letting actually is in 2026, and how the Renters' Rights Act, incorporation trends and EPC deadlines are reshaping the sector.
Every figure below carries its source and year so it can be quoted, checked and cited directly. Where two respected sources disagree (which happens more often than most articles admit), we show both rather than picking the more convenient number.
Last Updated: July 2026 | Next Update: October 2026
Key Landlord Statistics at a Glance
- There are approximately 2.82 million private landlords in England (English Private Landlord Survey / English Housing Survey, gov.uk).
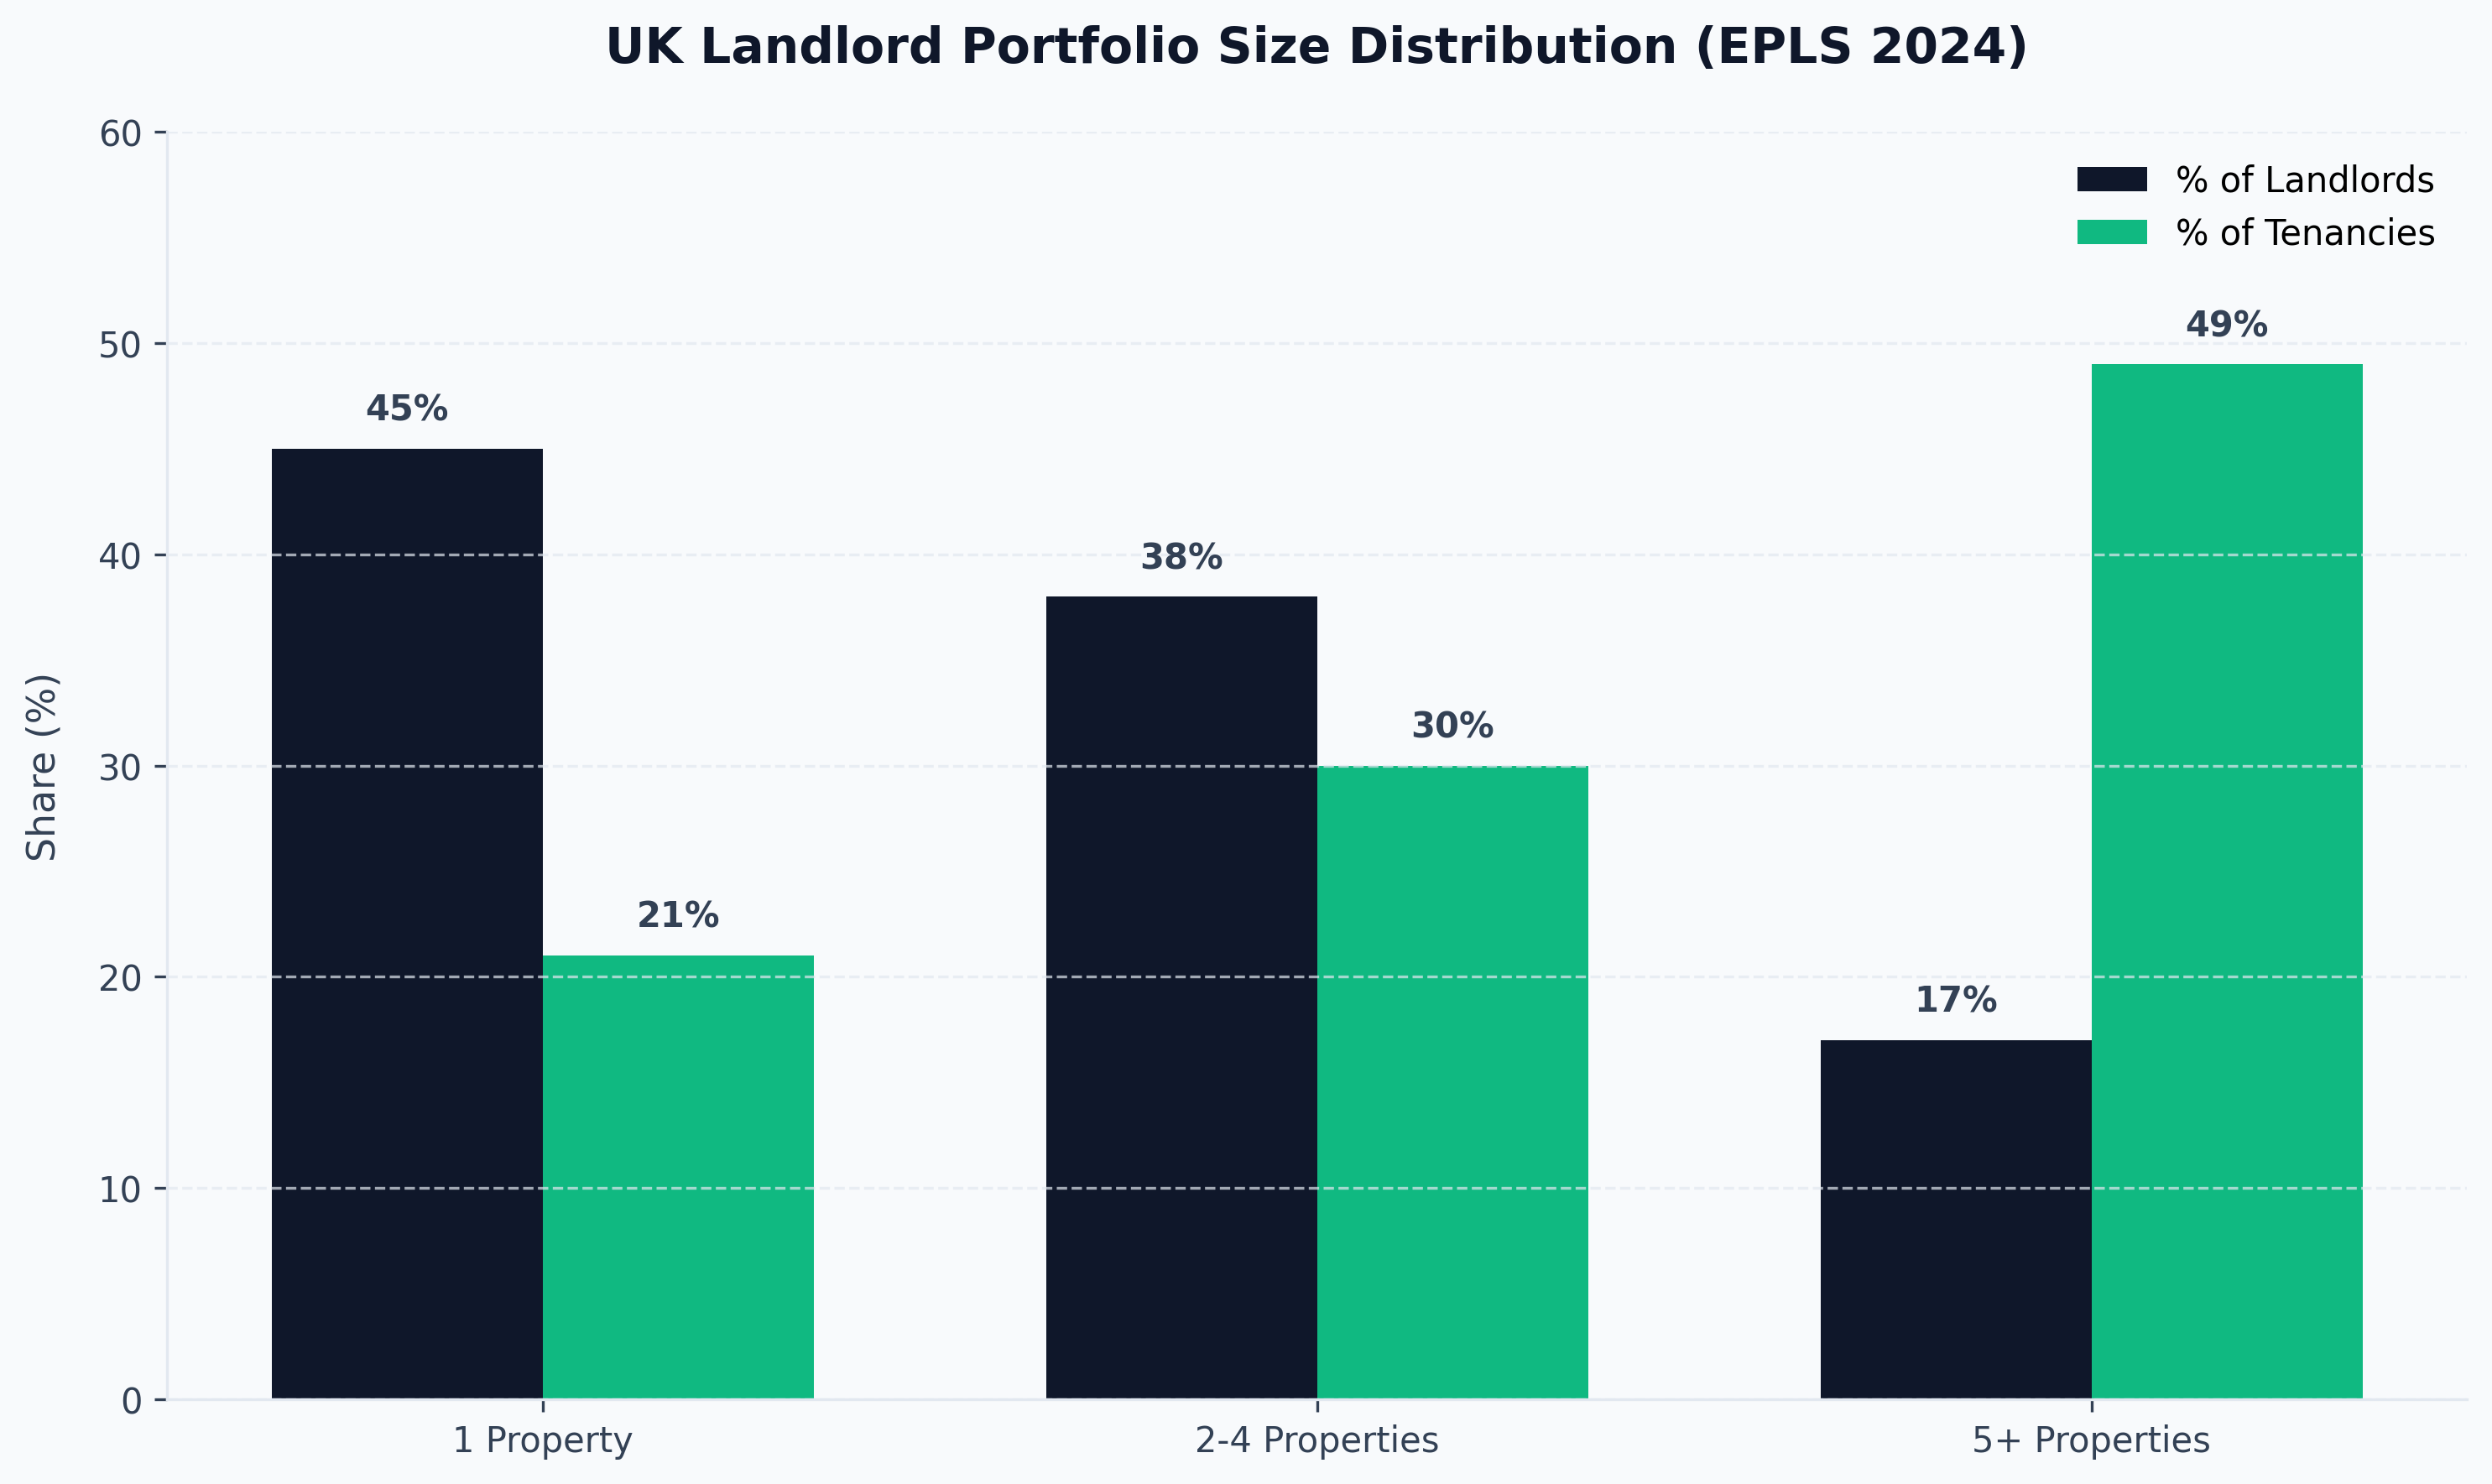
- 45% of landlords own a single rental property; 83% own between one and four; only 17% own five or more (English Private Landlord Survey 2024, gov.uk).
- Landlords with five or more properties, just 17% of all landlords, account for 49% of all tenancies (EPLS 2024).
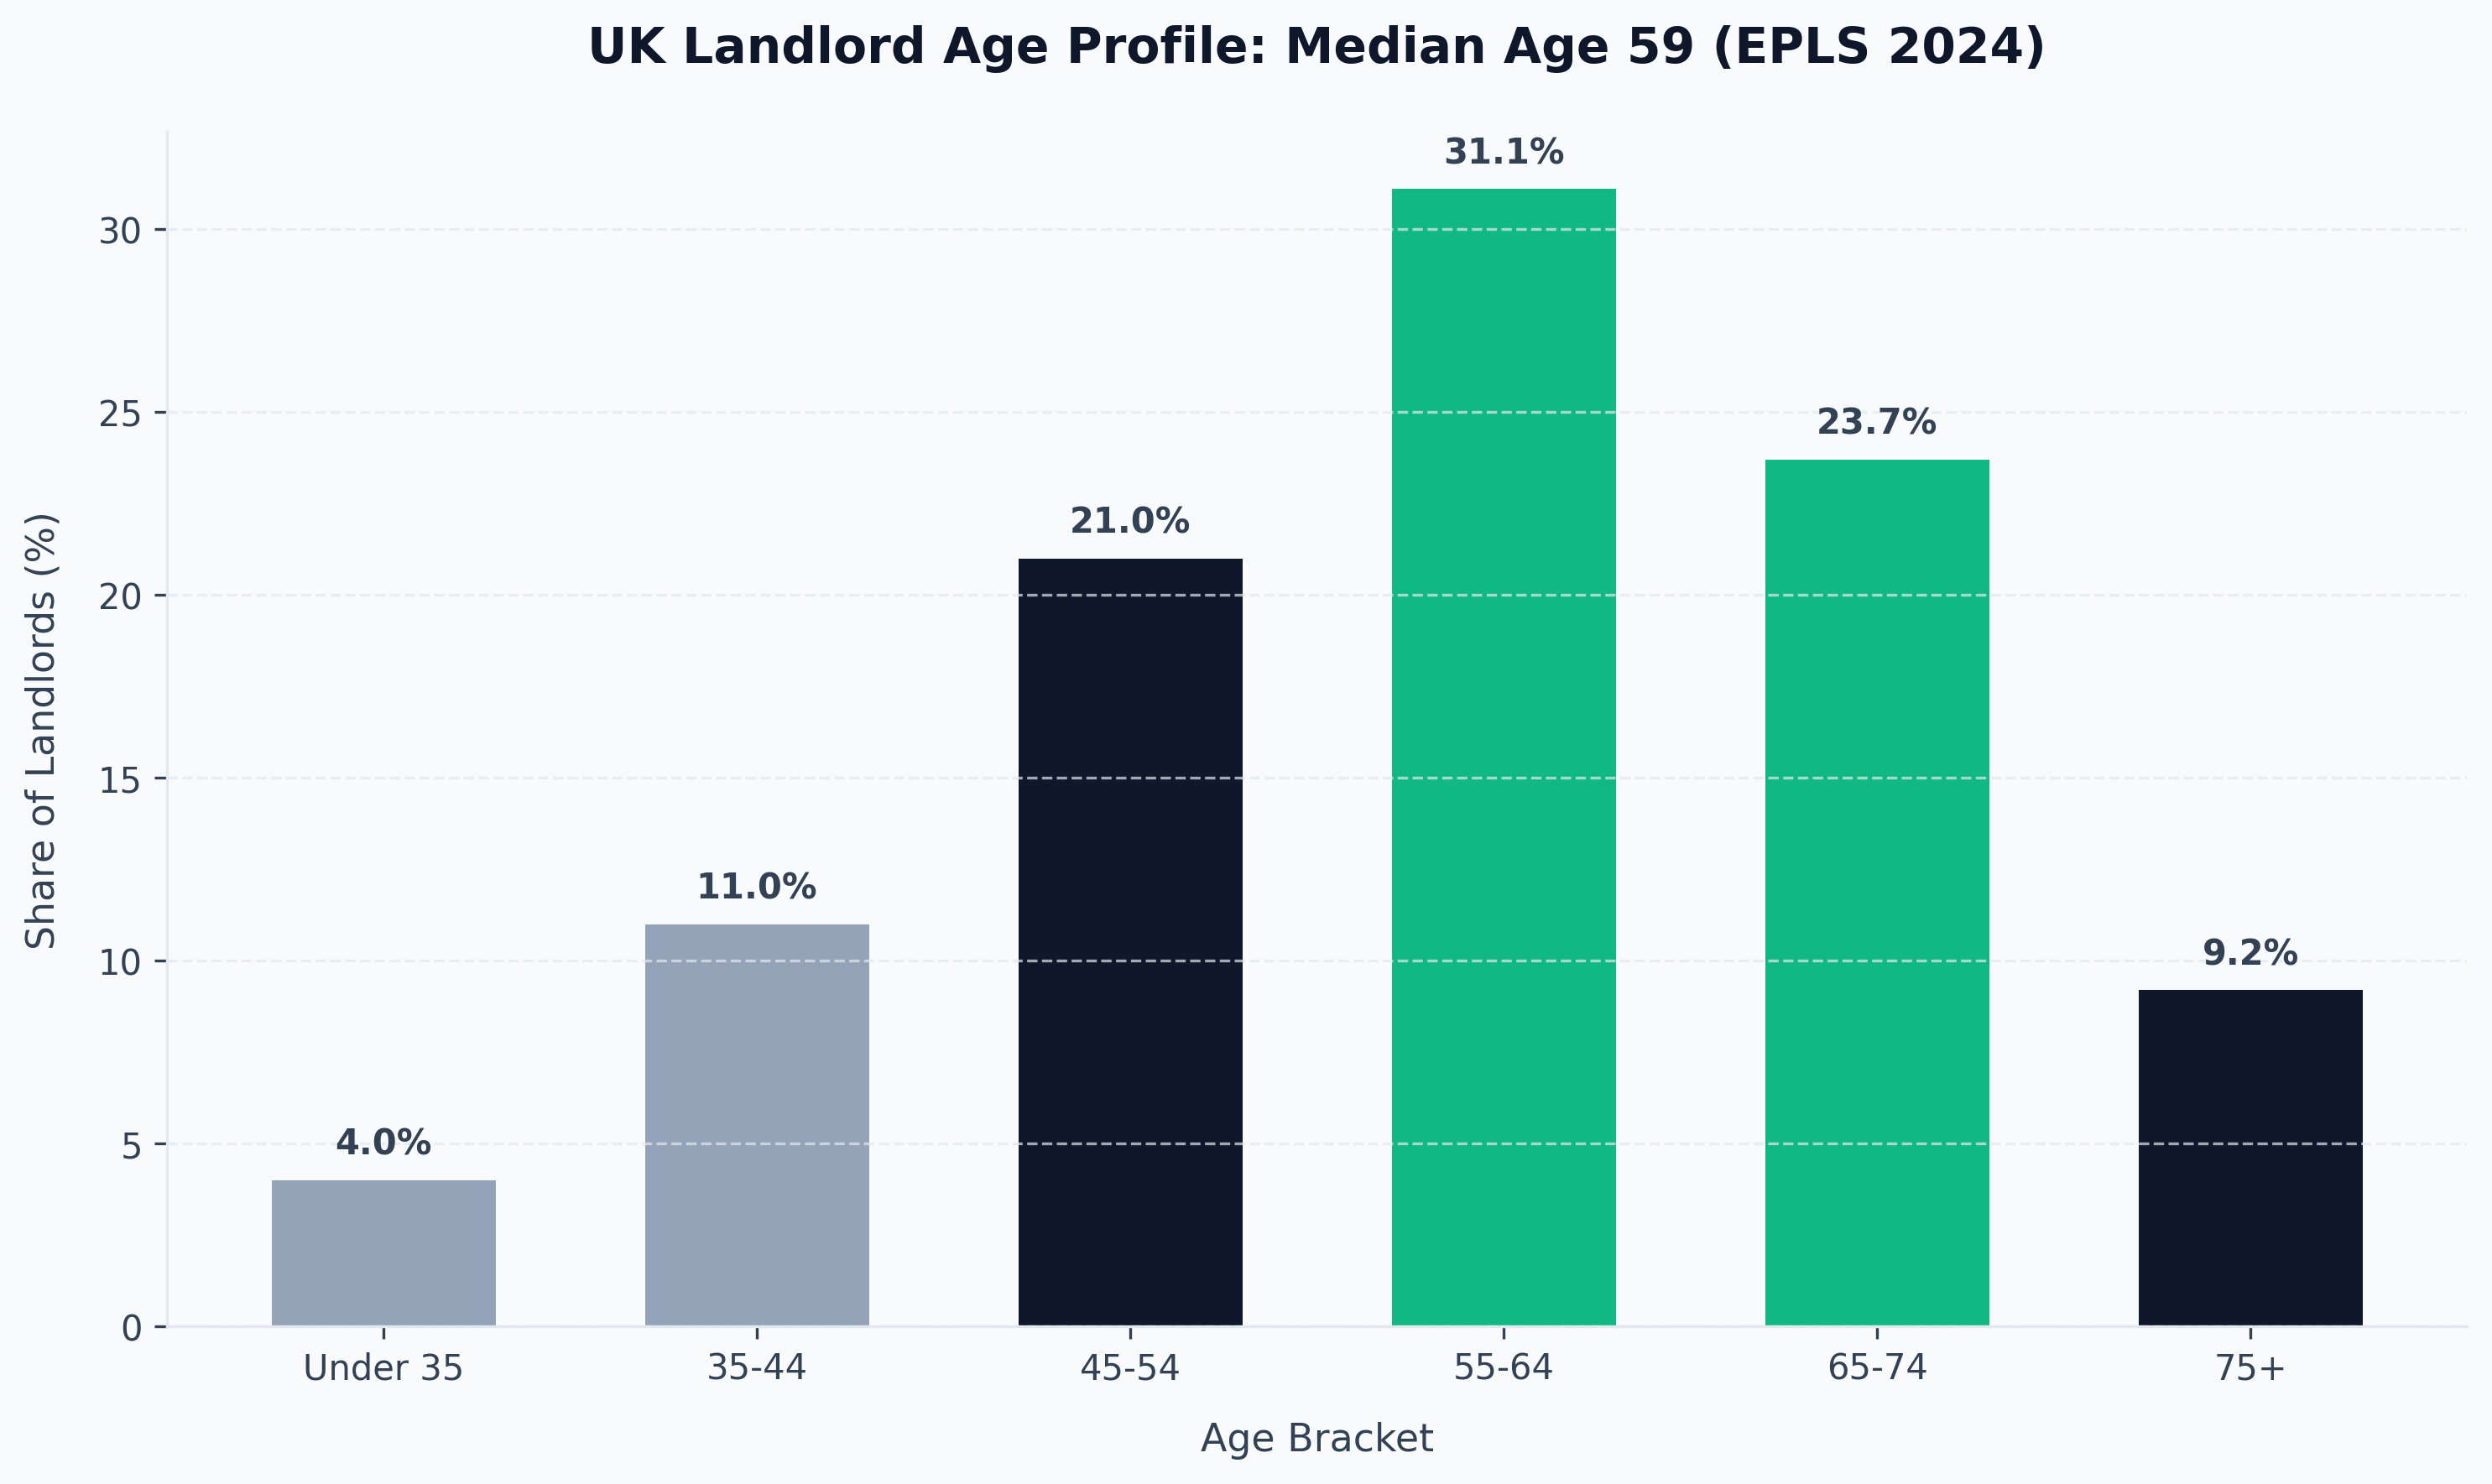
- The median age of an individual landlord is 59; 64% are aged 55 or older (EPLS 2024).
- For the first time on record, individual landlords are now 50% female and 49% male, up from 44% female in 2021 (EPLS 2024).
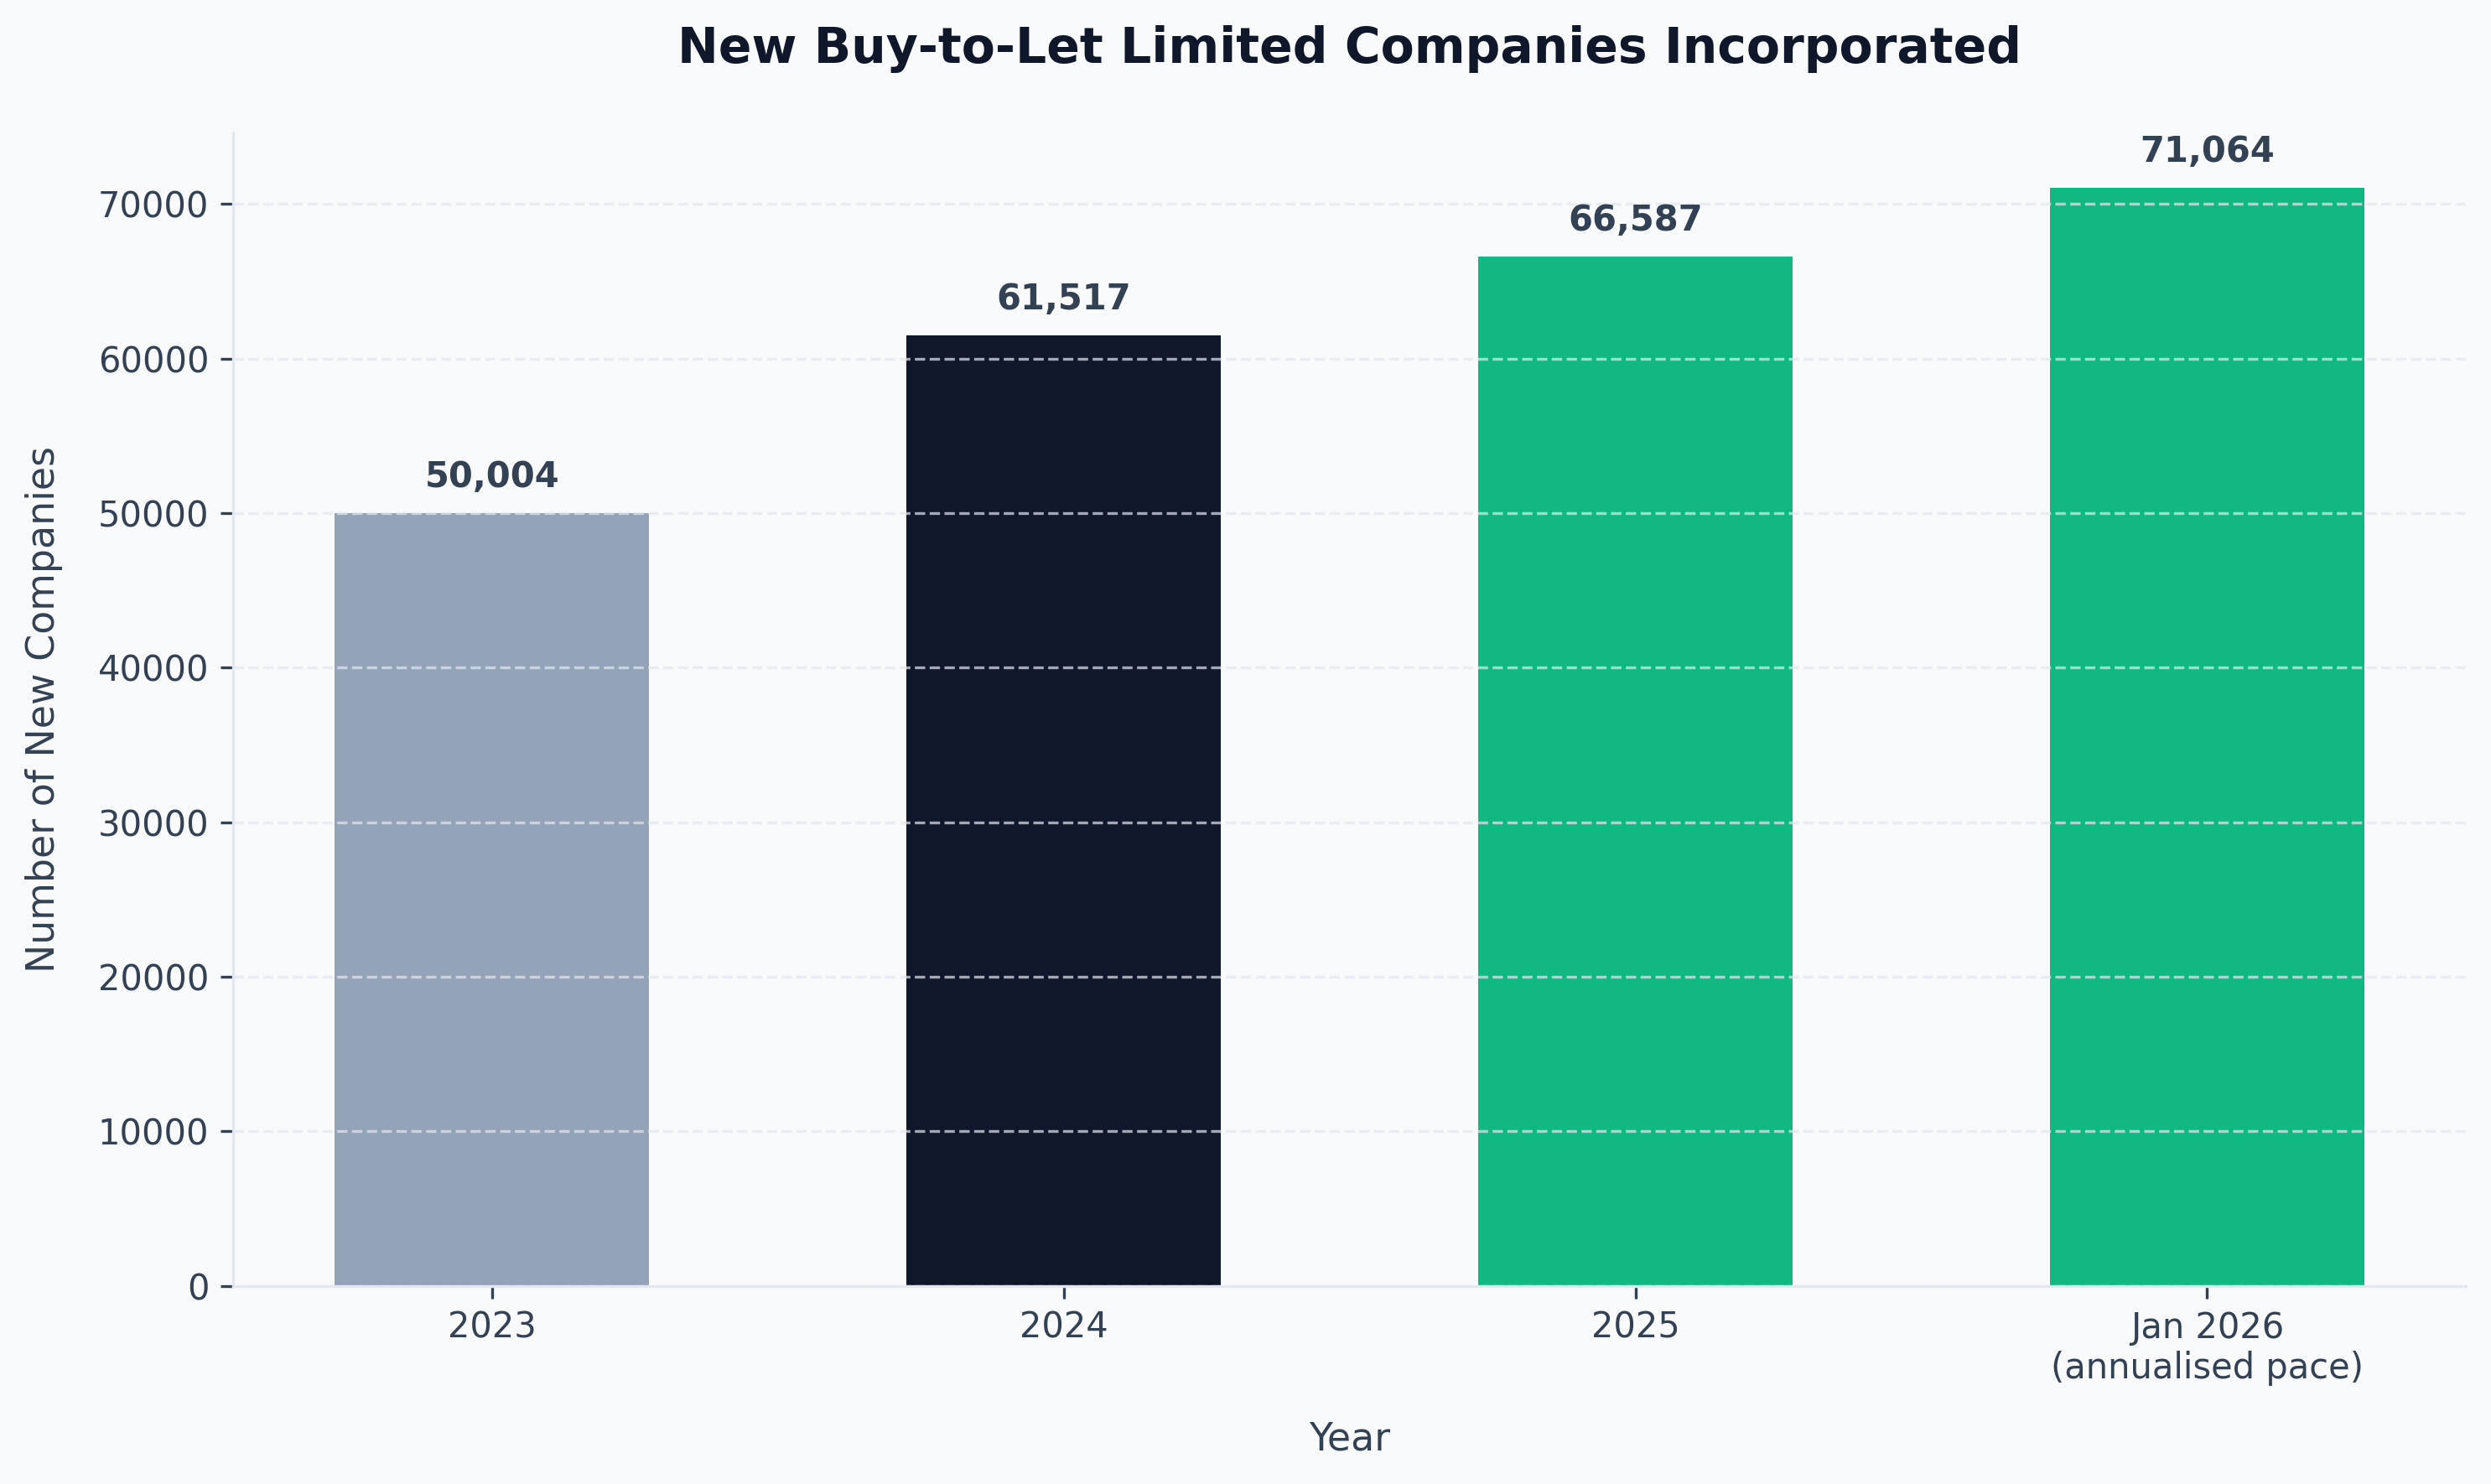
- A record 66,587 new buy-to-let limited companies were incorporated in 2025, and a further 5,922 in January 2026 alone, up 11% year on year (Hamptons/Companies House, 2026).
- There are now 443,272 active buy-to-let limited companies on the Companies House register, up from just 92,975 in February 2016 (Hamptons, 2025).
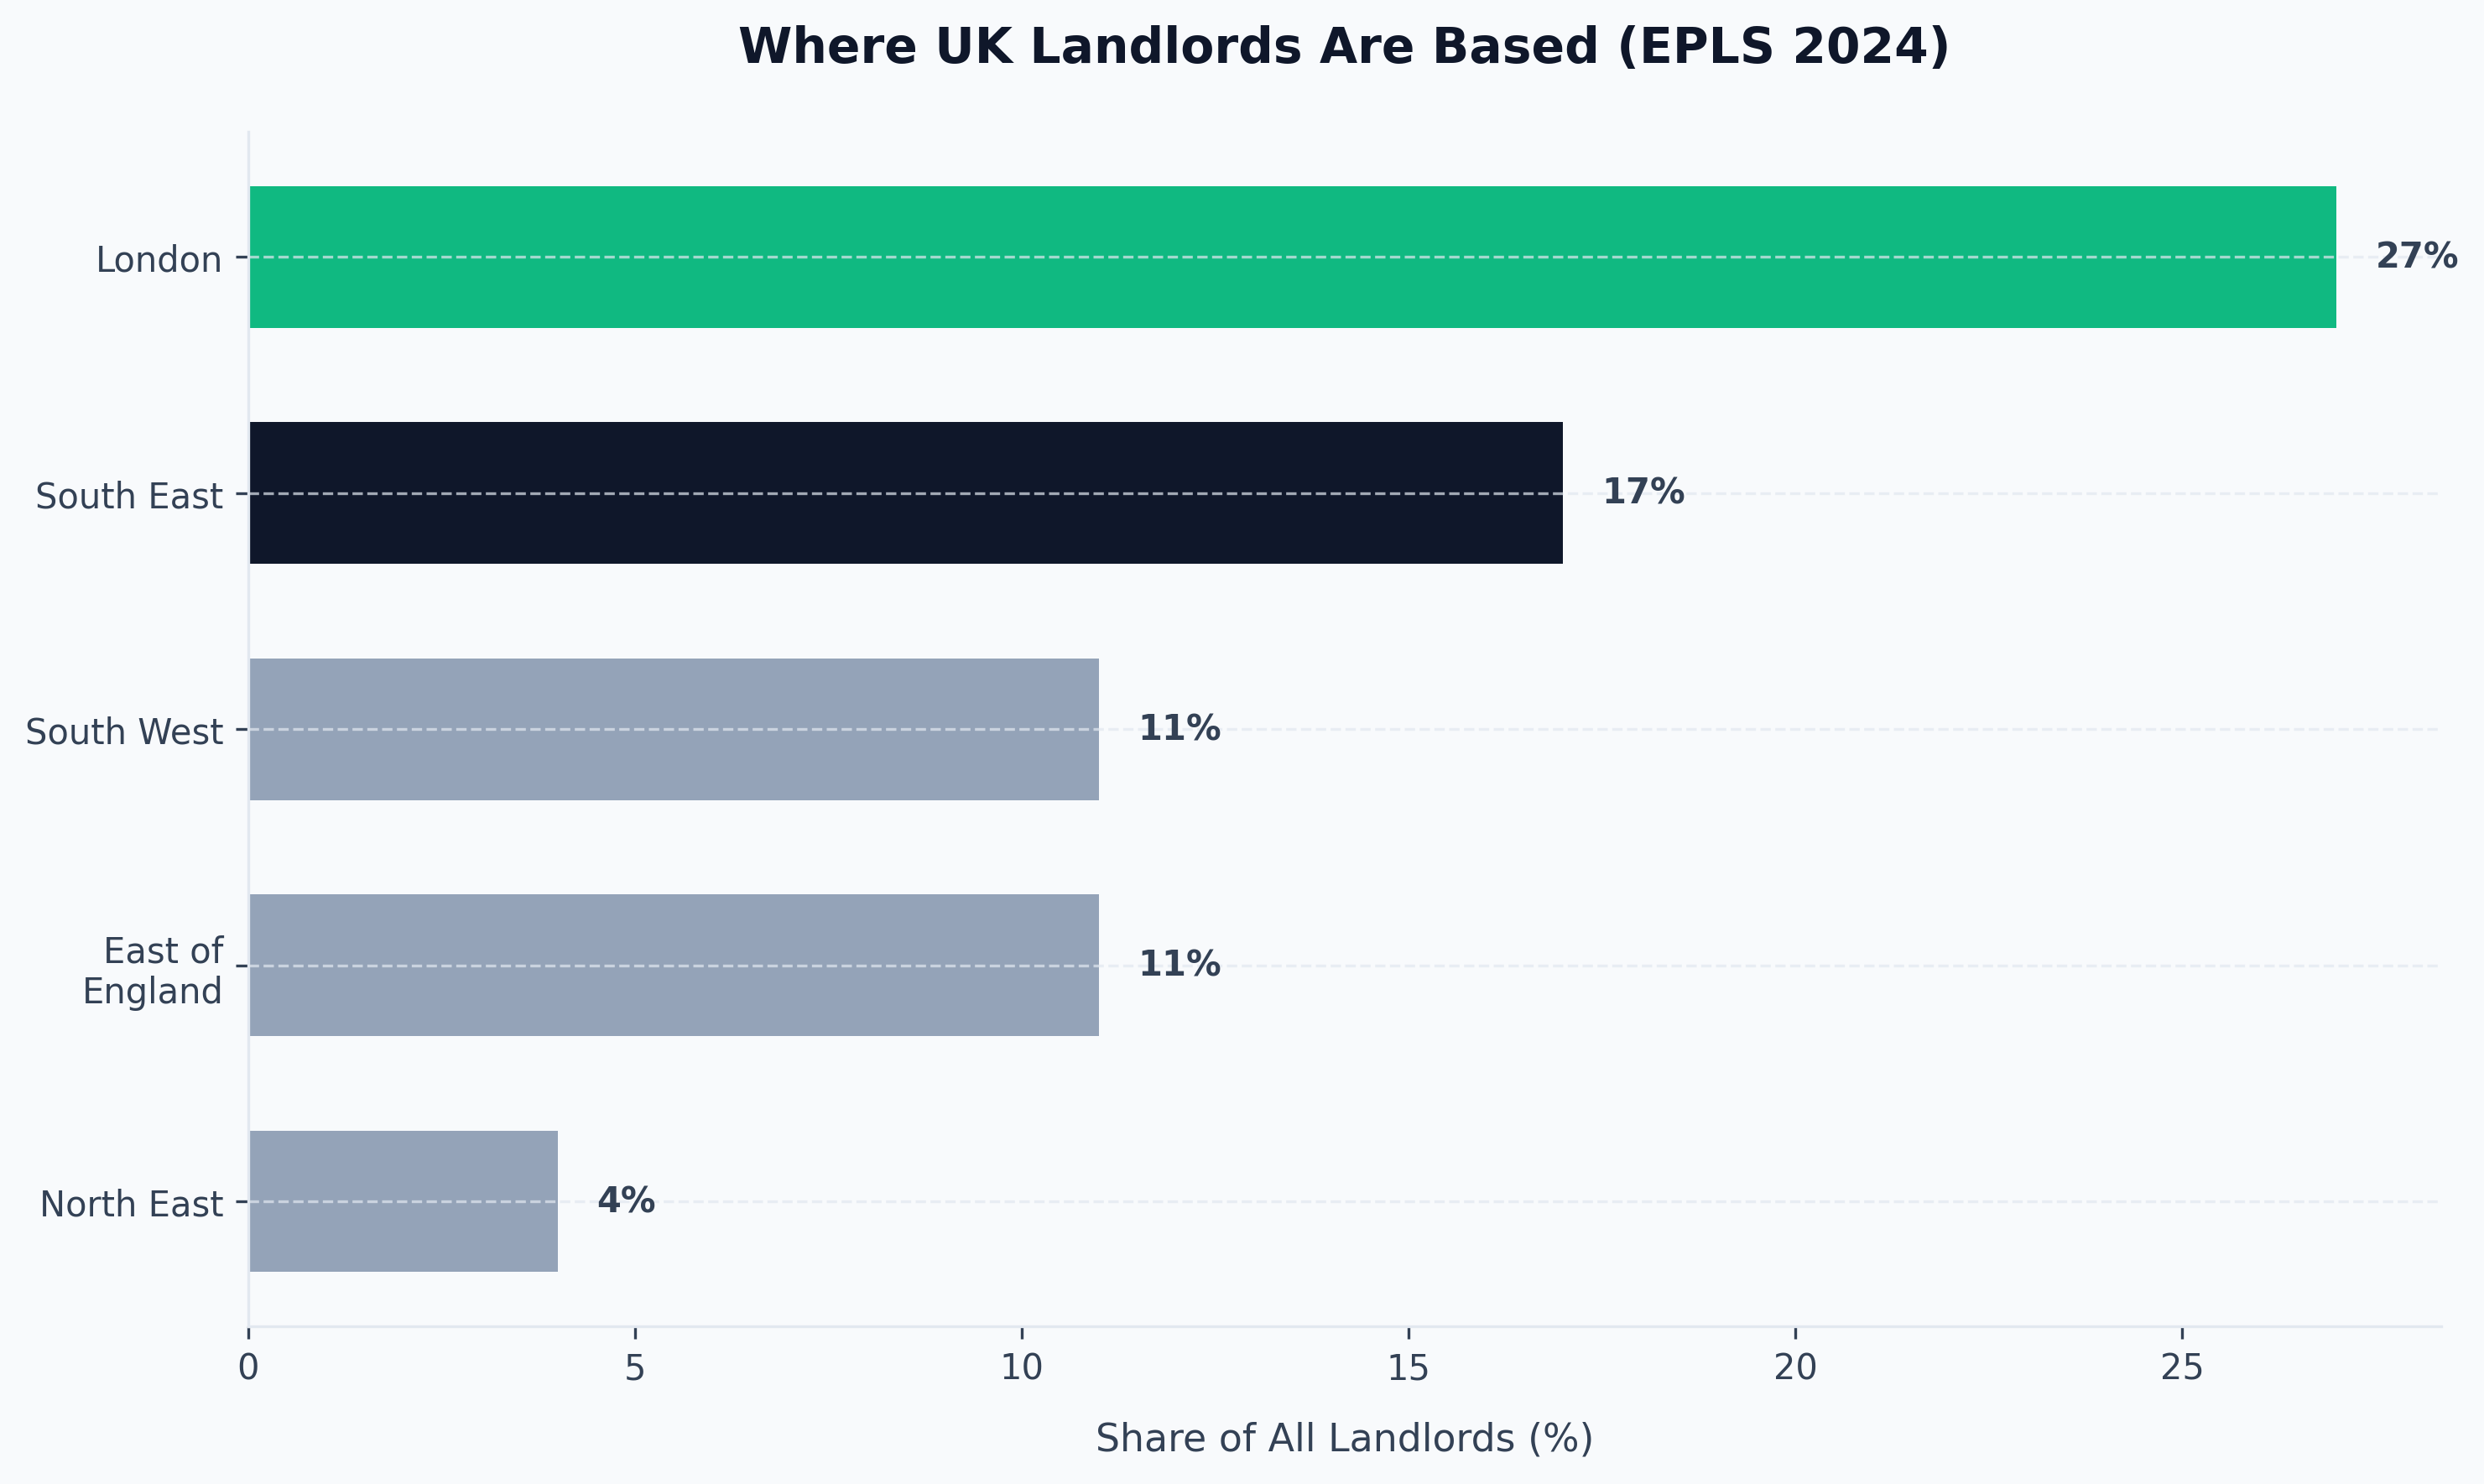
- London accounts for 27% of all landlords, the largest single region, followed by the South East at 17% (EPLS 2024).
- The average national gross rental yield stands at 5.8% on a full-market basis (Zoopla, 2026), or 8.1% on specialist buy-to-let lender completions (Fleet Mortgages, Q1 2026).
- 84% of buy-to-let landlords reported their lettings were profitable in Q1 2026, against an average yield of 6.5% (Foundation Home Loans/Pegasus Insight, Q1 2026).
- The NRLA Landlord Confidence Index rose to 30.3 in Q1 2026, its biggest quarterly jump since Q3 2023, but still the second-lowest reading since the index began in 2019 (NRLA, 2026).
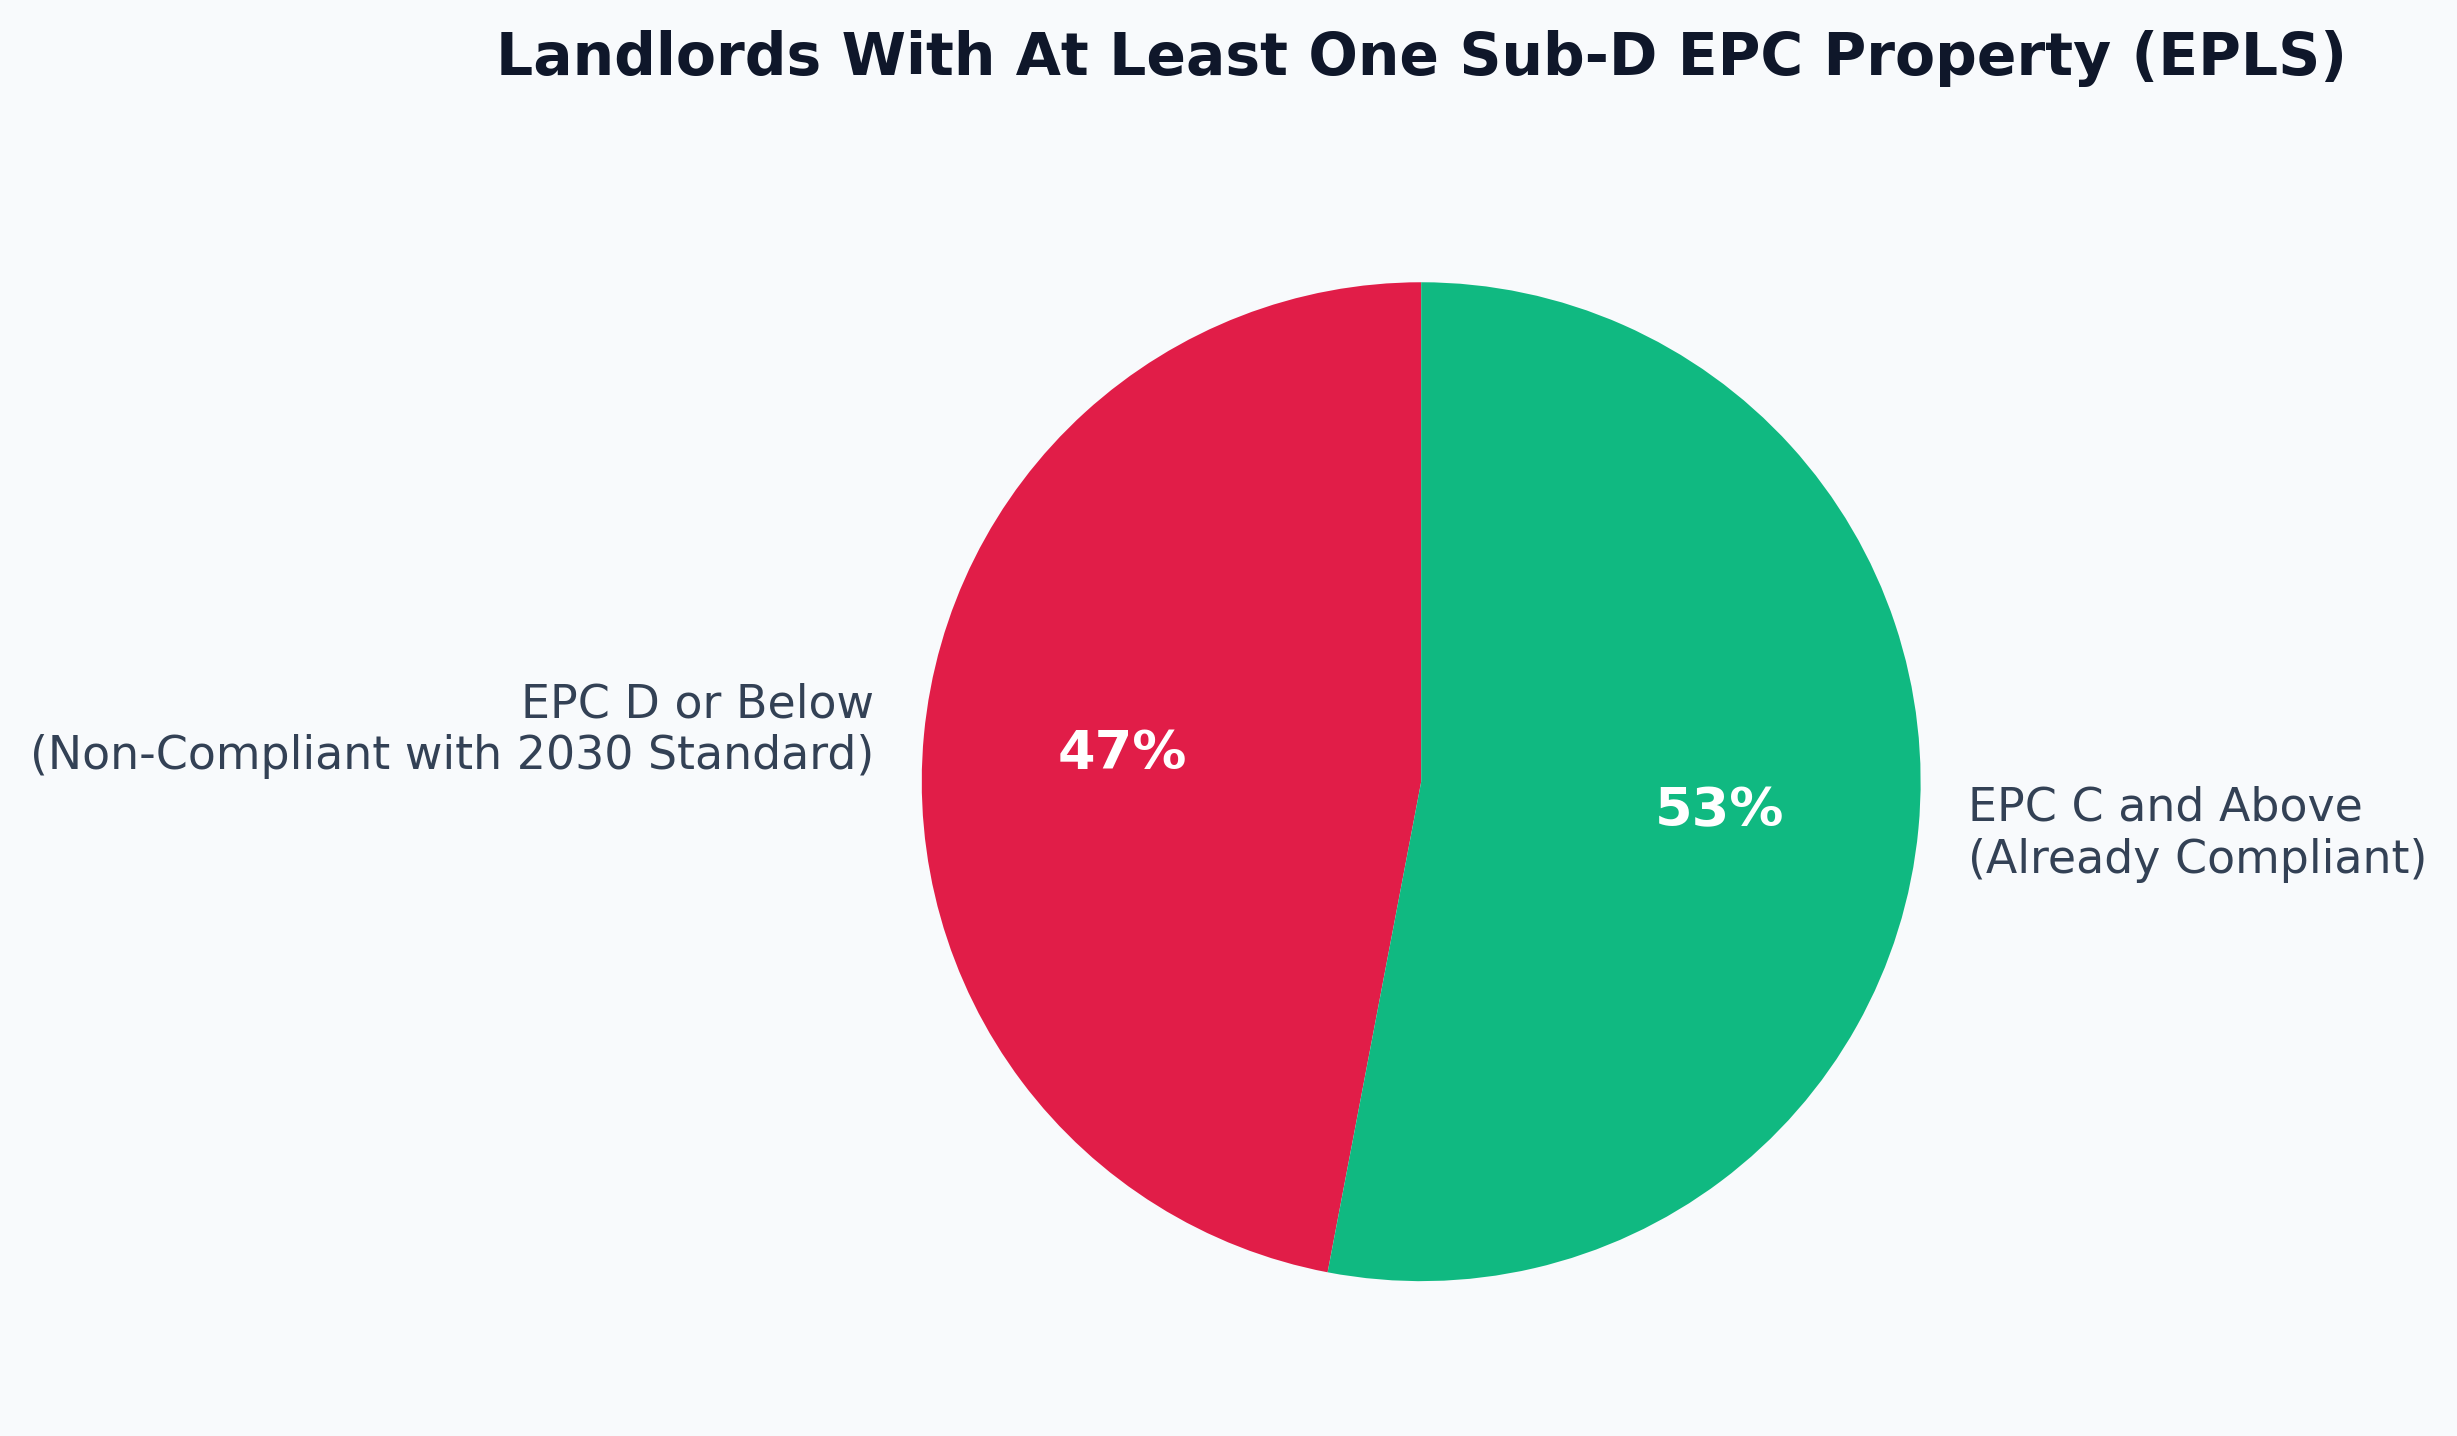
- 47% of landlords have at least one property rated EPC D or below; 35% of those plan to upgrade it (English Private Landlord Survey, gov.uk).
- The Renters' Rights Act came into force on 1 May 2026, abolishing Section 21 "no fault" evictions across England (gov.uk/NRLA, 2026).
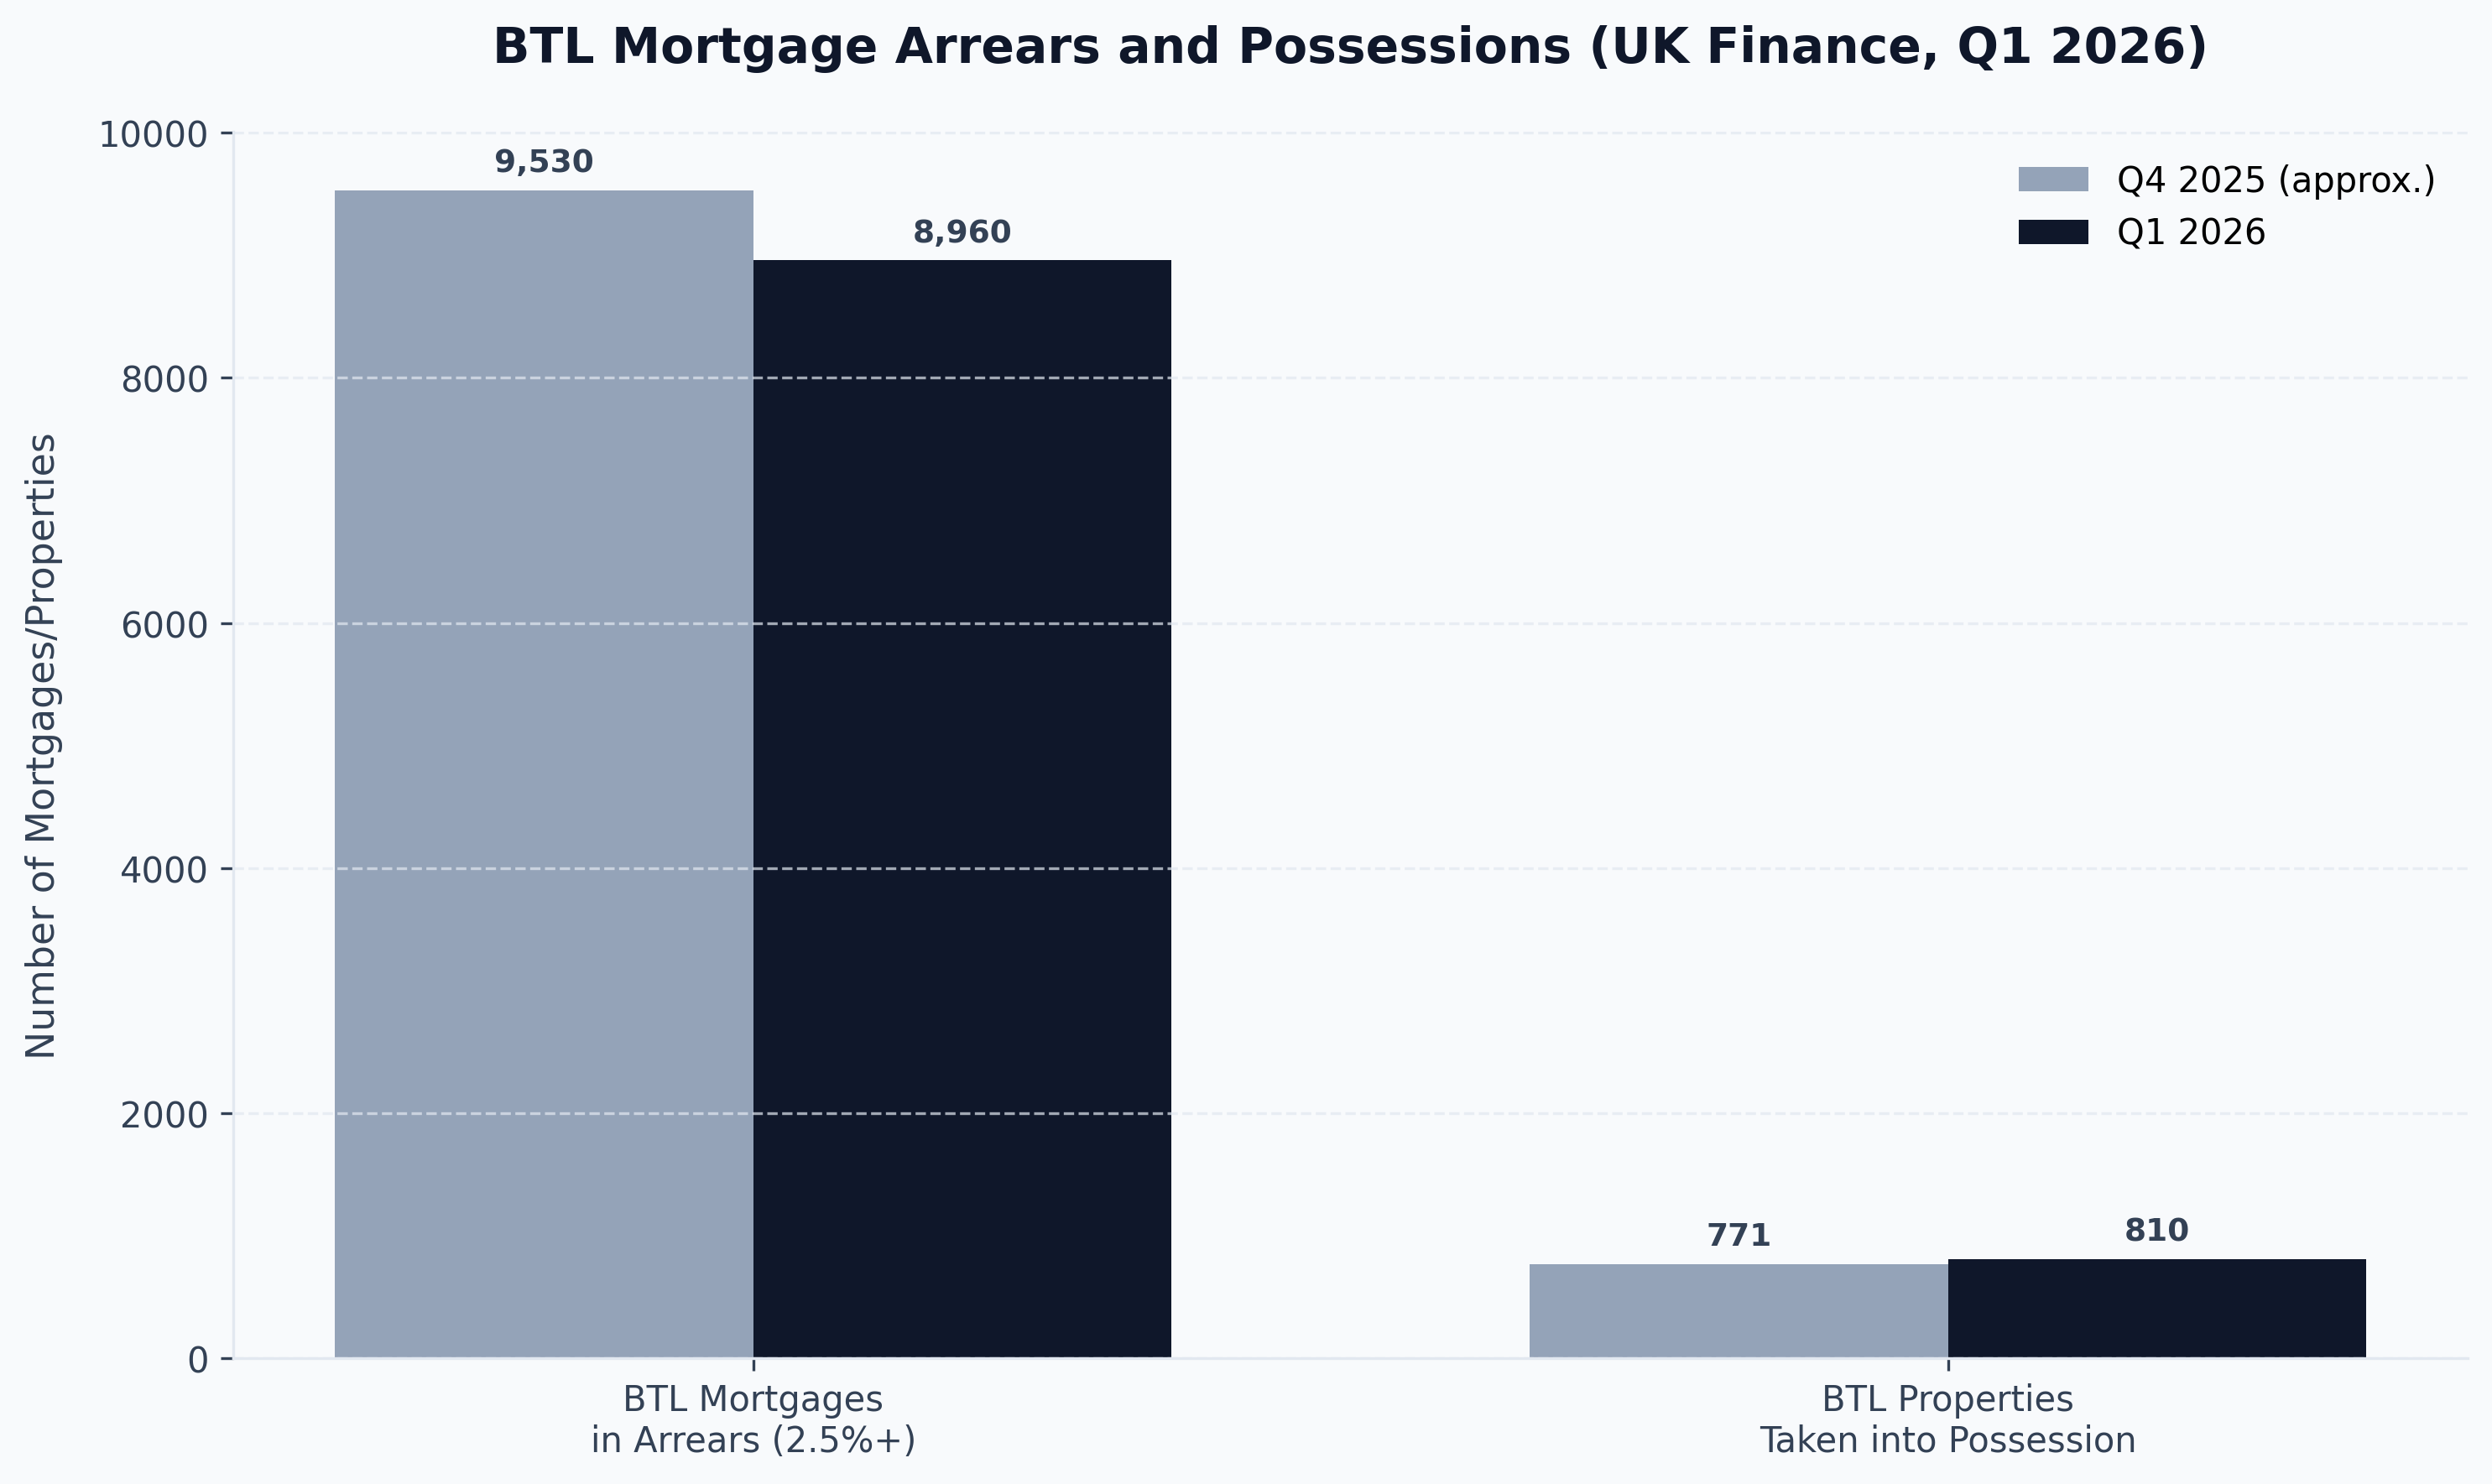
- Just 8,960 buy-to-let mortgages, or 0.47% of the total, were in arrears of 2.5% or more of the balance in Q1 2026, down 6% quarter on quarter (UK Finance, Q1 2026).
- Landlords accounted for 13.3% of all property purchases in Great Britain between January and April 2026, the highest share since 2016 (Hamptons/Connells Group, 2026).
Source note: This page draws on the English Private Landlord Survey and English Housing Survey (gov.uk/MHCLG), UK Finance, NRLA, Hamptons research, Zoopla, Fleet Mortgages and Pegasus Insight/Foundation Home Loans. Individual figures are attributed inline; last verified July 2026.
How Many Landlords Are There in the UK?
The most authoritative headline figure comes from the English Private Landlord Survey (EPLS), the government's own census of the sector, which puts the number of private landlords in England at approximately 2.82 million. That estimate has been reaffirmed in commentary around the 2024 EPLS release and remains the standard reference figure used across the industry.
Set against roughly 4.7 million privately rented households in England (a figure that recurs across the ONS, Zoopla and Hamptons datasets), that works out at an average of around 1.6 to 1.7 rental properties per landlord. This average is misleading on its own, however, because the distribution is heavily skewed: a small minority of professional portfolio landlords own a large share of total stock, while the majority own a single property let almost incidentally.
The Long-Term Growth Trend
| Period | Privately Rented Households (England) | Source |
|---|---|---|
| 2008-09 | 3.1 million | English Housing Survey, gov.uk |
| 2020-21 | 4.4 million (+45% vs 2008-09) | English Housing Survey, gov.uk |
| 2024-25 | ~4.7 million | ONS / EHS Headline Report 2024-25 |
| 2026 | ~4.7 million (broadly flat) | ONS, Zoopla, Hamptons |
The sector's fastest growth phase was 2008 to 2021, when the private rented sector nearly doubled its 2001 size. Since 2021, growth in the total number of rented households has flattened even as churn within the sector, landlords selling to other landlords, and consolidation among portfolio investors, has accelerated. This is a structural shift worth understanding alongside the broader UK rental market statistics for 2026, which covers the tenant demand side of the same market.
Landlord Portfolio Sizes: Who Owns What
The single most misunderstood fact about the UK private rented sector is how small most landlords actually are. The English Private Landlord Survey 2024 breaks portfolio size down as follows.
Portfolio Size Distribution (EPLS 2024)
| Portfolio Size | % of Landlords | % of Tenancies |
|---|---|---|
| 1 property | 45% | 21% |
| 2 to 4 properties | 38% | 30% |
| 1 to 4 properties (combined) | 83% | 51% |
| 5 or more properties | 17% | 49% |
Read that table carefully: 17% of landlords, the "portfolio" or "professional" segment, control very nearly half of all tenancies in England. This bifurcation matters for policy design (a blanket rule affecting "landlords" hits a hobbyist with one flat and a 40-property portfolio operator very differently) and for competitive positioning: portfolio landlords increasingly source stock through structured channels such as property sourcing companies rather than buying reactively on the open market, which is one reason acquisition activity has consolidated among larger holders even as the total number of landlords has been broadly flat.
The practical implication for a new or smaller investor is that scale itself is not the strategy; portfolio landlords typically reached that size over many years of reinvestment, not from an initial large purchase.
Landlord Demographics: Age, Gender and Management Style
Age Profile (EPLS 2024)
| Age Bracket | % of Landlords |
|---|---|
| Under 35 | 4% |
| 35-44 | 11% |
| 45-54 | 21% |
| 55-64 | 31.1% |
| 65-74 | 23.7% |
| 75+ | 9.2% |
The median individual landlord is 59 years old, and 64% are aged 55 or above, virtually unchanged since the 2021 survey. 85% of landlords are over 45. This is a sector dominated by people who bought their first rental property well before the 2016 stamp duty surcharge and the 2017 mortgage interest relief changes, and who are now managing legacy portfolios rather than actively building new ones.
Gender Split: A Genuine Shift
For the first time in the survey's history, individual landlords are now 50% female and 49% male (with 1% identifying as other), up from 44% female in 2021 (EPLS 2024). That headline masks a sharp split by scale, however: among landlords with five or more properties, 63% are male, meaning the gender balance is far more even at the single-property end of the market than at the professional, portfolio end.
How Landlords Manage Their Properties
| Approach | % of Landlords |
|---|---|
| Self-managed (no agent) | 52% |
| Use agent for letting only | 43% |
| Use agent for ongoing management | 18% |
Agent use rises sharply with portfolio size: 63% of landlords with five or more properties use a letting agent, against 50% of those with two to four properties and just 30% of single-property landlords (EPLS 2024). Smaller landlords are more hands-on out of necessity or cost-sensitivity; larger operators buy in professional management as a matter of course.
The Incorporation Trend: Limited Company Buy-to-Let
Incorporation is the single biggest structural change in how UK landlords hold property, and the data shows no sign of it slowing.
New Buy-to-Let Company Incorporations
| Year | New BTL Companies Formed | YoY Change |
|---|---|---|
| 2023 | 50,004 | - |
| 2024 | 61,517 | +23% |
| 2025 | 66,587 | +8% (record) |
| Jan 2026 | 5,922 | +11% vs Jan 2025 |
Source: Hamptons research, using Companies House data (2025-2026).
The 443,272 active buy-to-let companies now on the Companies House register (Hamptons, 2025) compares with just 92,975 in February 2016, a roughly 4.8-fold increase in under a decade. Notably, the incorporation wave is generational as much as fiscal: Hamptons estimates that millennials (born 1981-1996) accounted for around 50% of shareholders in new buy-to-let companies set up in 2025, and were on track to establish a record 33,395 new companies that year, more than double the number they incorporated in 2020.
The primary driver remains Section 24 mortgage interest relief restrictions, which do not apply to limited company borrowing, alongside the incoming rental income surcharge for individual landlords due from April 2027. Our limited company buy-to-let guide sets out the tax mechanics, lender criteria and transfer costs involved in moving an existing portfolio into corporate structure, which is rarely as simple as forming a company and continuing as before.
Regional Analysis: Where Britain's Landlords Are and What They Earn
Where Landlords Are Based (EPLS 2024)
| Region | % of All Landlords | Median Landlord Rental Income |
|---|---|---|
| London | 27% | £24,500 |
| South East | 17% | Not separately published |
| South West | 11% | Not separately published |
| East of England | 11% | Not separately published |
| North East | 4% (smallest share) | £12,000 (lowest) |
London alone accounts for over a quarter of all landlords in England, more than the next two regions combined, reflecting both higher property values and historically stronger yields on capital growth (if not on income). The North East, by contrast, has the smallest landlord population and the lowest median rental income, but as the next table shows, the best income yields relative to purchase price.
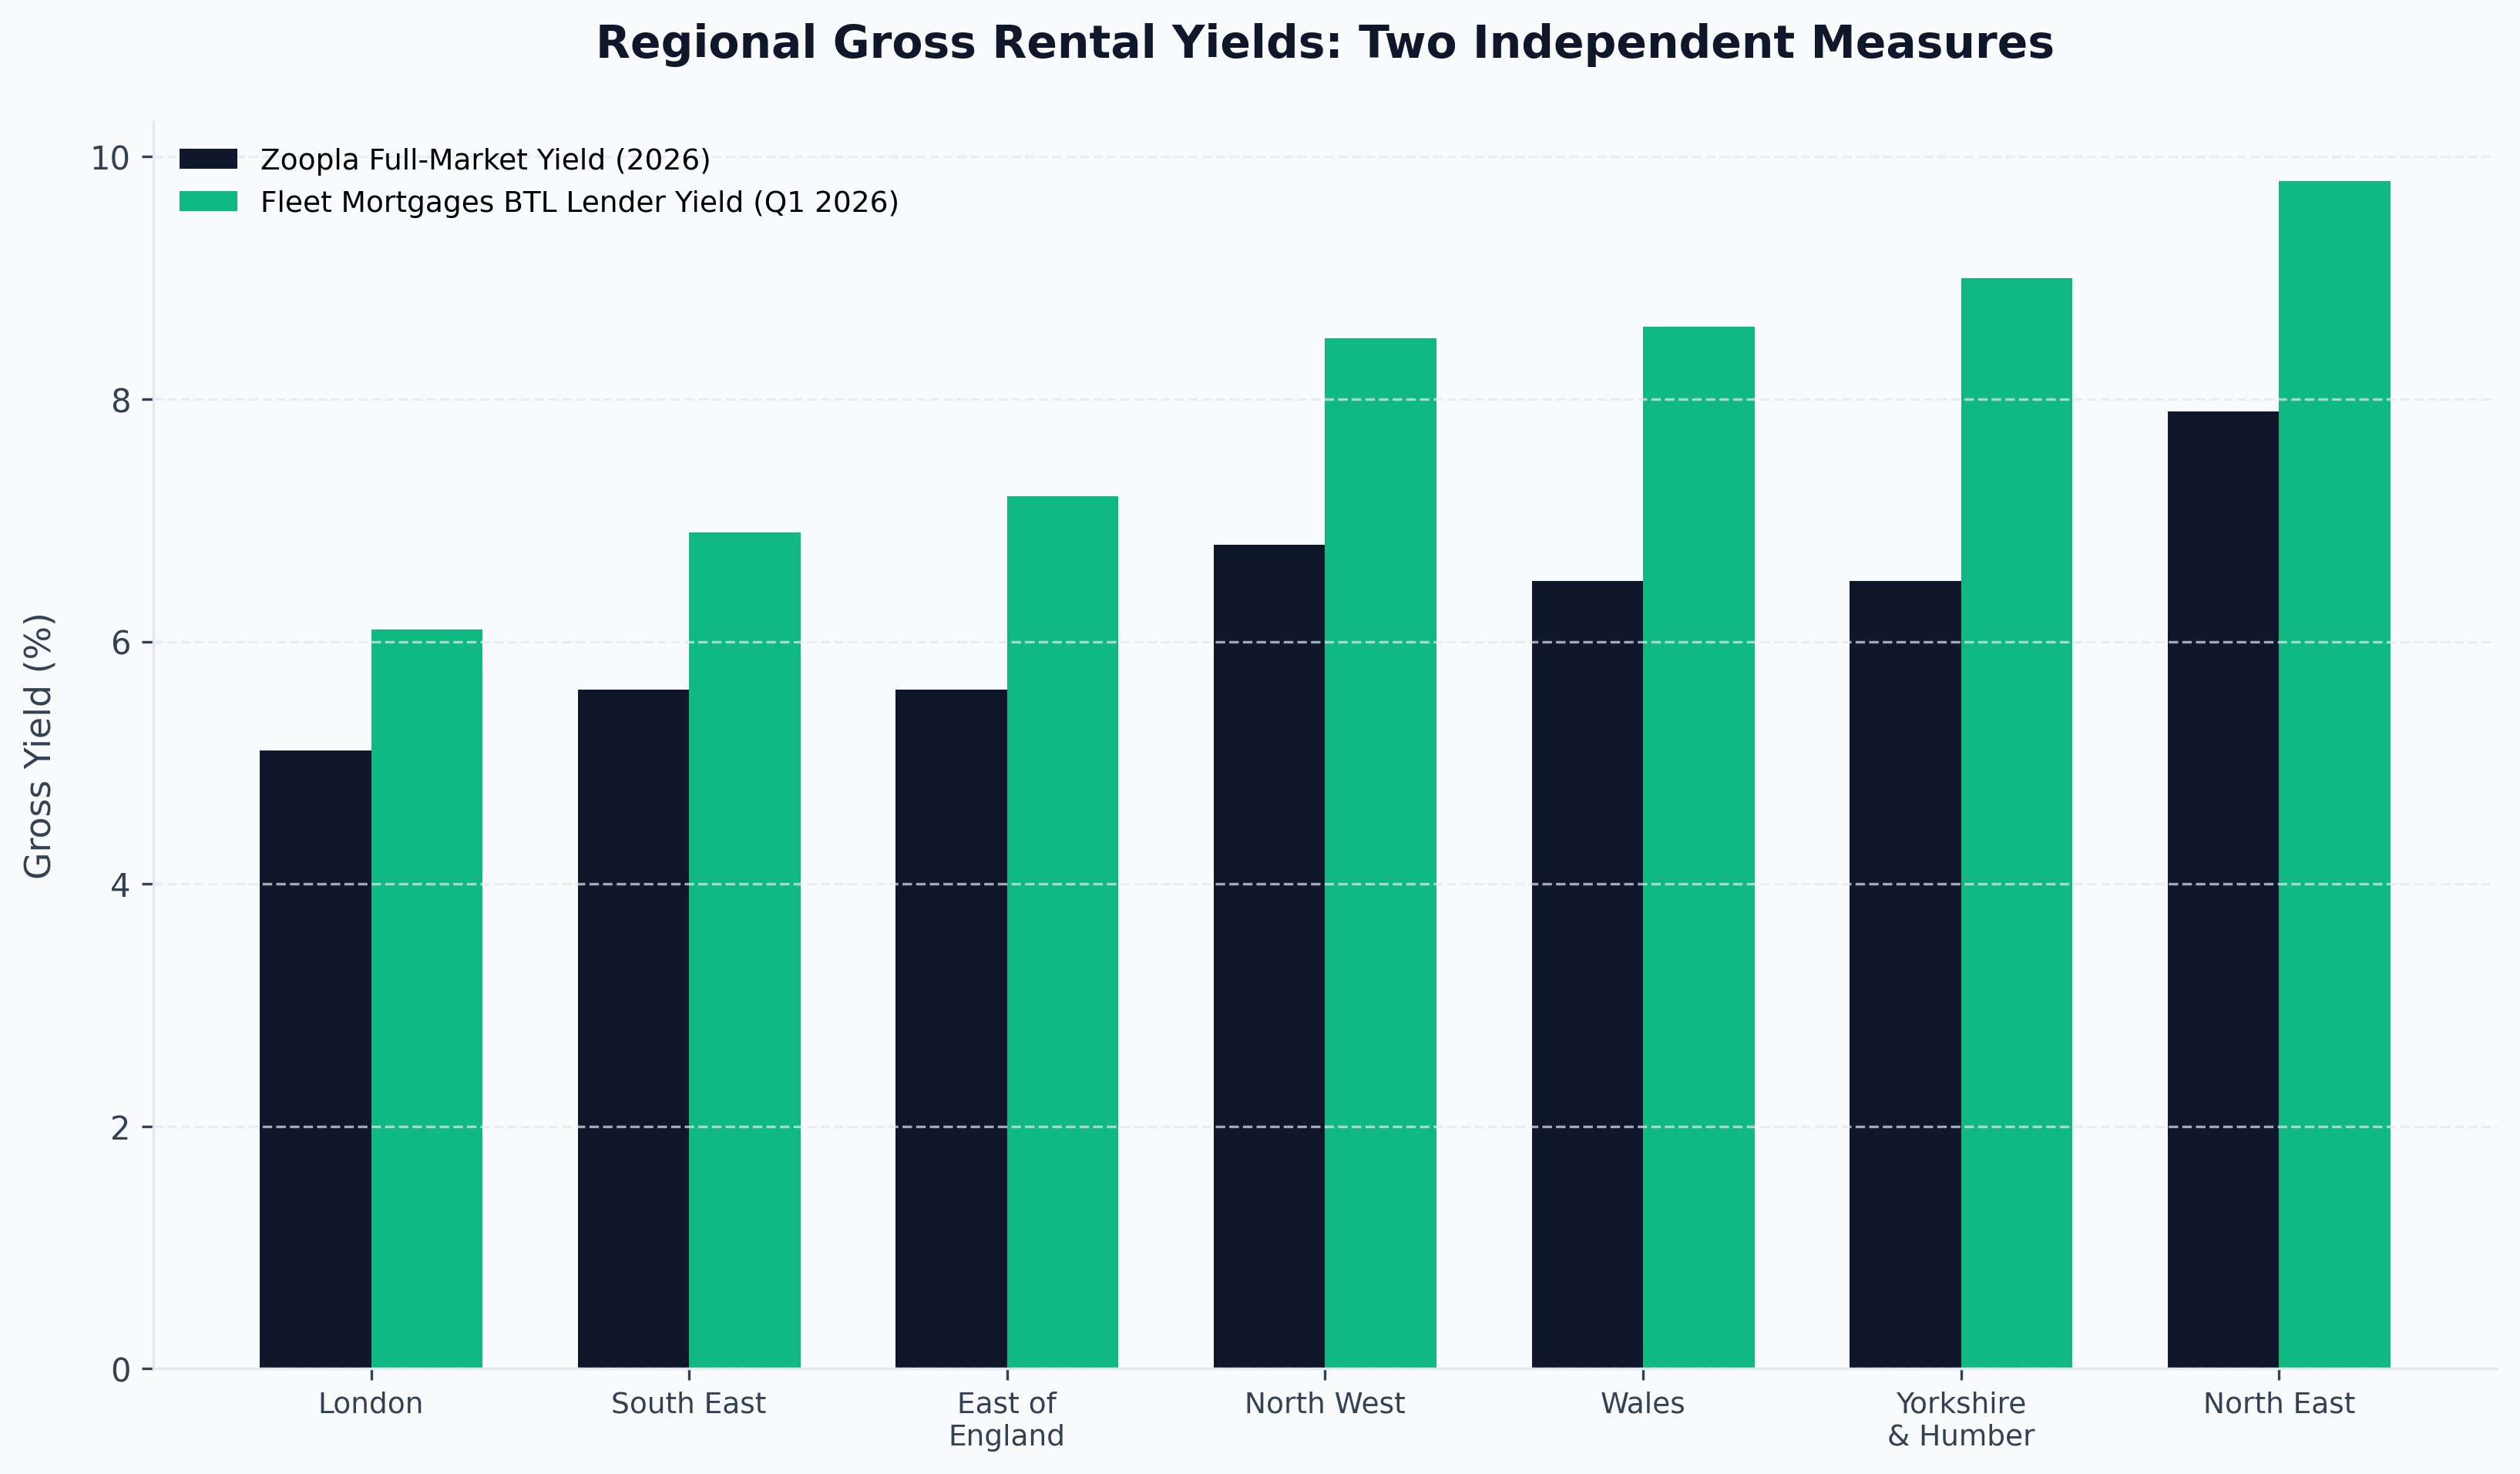
Regional Gross Rental Yields: Two Independent Measures
Full-market yield data (covering all advertised rental stock) and specialist buy-to-let lender data (covering only mortgaged BTL completions, which skew toward HMOs and portfolio purchases) tell a similar regional story but produce different absolute numbers. Both are shown here because each is useful for a different purpose.
| Region | Zoopla Full-Market Yield (2026) | Fleet Mortgages BTL Lender Yield (Q1 2026) |
|---|---|---|
| North East | 7.9% | 9.8% |
| Yorkshire & Humber | 6.5% | 9.0% |
| West Midlands | Not separately published | 8.6% |
| Wales | 6.5% | 8.6% |
| North West | 6.8% | 8.5% |
| East Midlands | Not separately published | 8.0% |
| South West | Not separately published | 7.8% |
| Scotland | 7.6% | Not covered |
| East of England | 5.6% | 7.2% |
| South East | 5.6% | 6.9% |
| London | 5.1% | 6.1% |
| UK/GB Average | 5.8% | 8.1% |
The gap between the two datasets (5.8% national average against 8.1%) is not a contradiction; it reflects methodology. Zoopla's figure is calculated across the full advertised rental stock including flats and standard buy-to-let houses in high-value southern markets, while Fleet Mortgages' book is weighted toward complex and portfolio buy-to-let lending, including HMOs, which structurally carry higher yields. Investors comparing yield claims across sources should always check which population is being measured before treating a headline number as comparable.
For a fuller breakdown of tenant demand, rent levels and void periods by region, see our UK rental market statistics 2026 page, and for mortgage-specific lending volumes by product, see UK buy-to-let statistics 2026.
Landlord Profitability and Sentiment: Selling Up or Doubling Down?
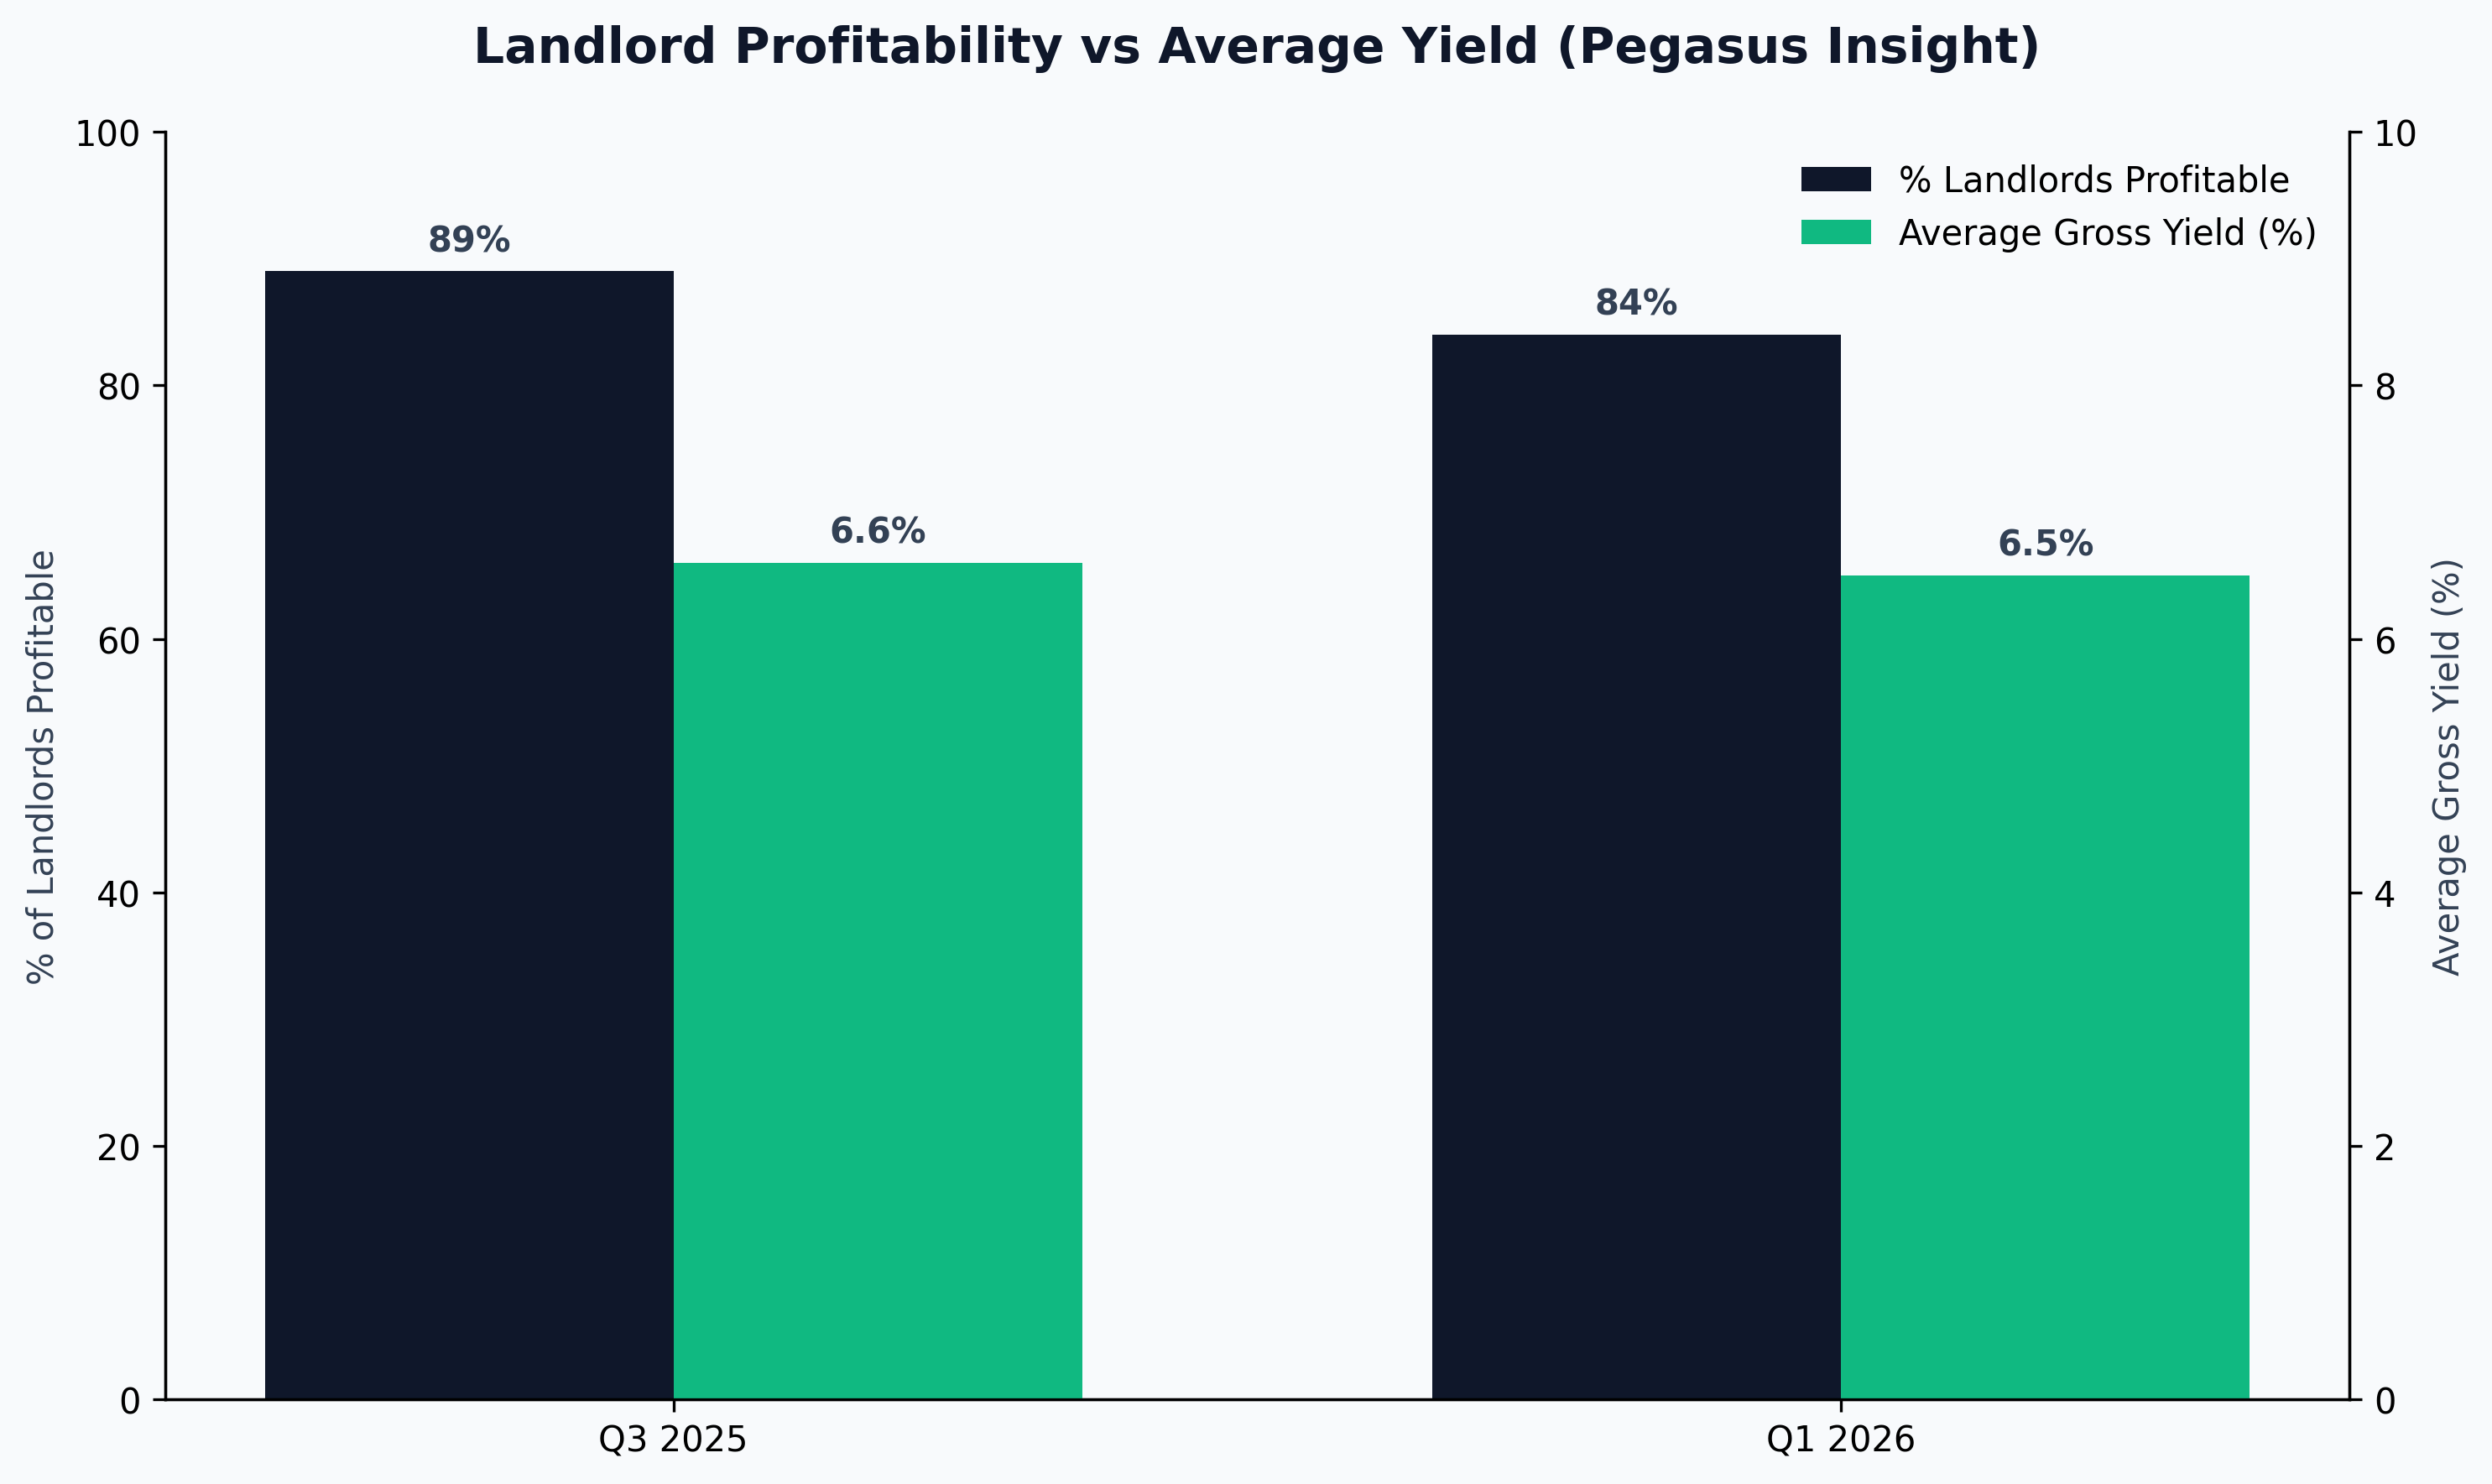
Profitability Over Time
| Period | % of Landlords Profitable | Average Gross Yield | Source |
|---|---|---|---|
| Q3 2025 | 89% | 6.6% (decade high) | Pegasus Insight Landlord Trends |
| Q1 2026 | 84% | 6.5% | Foundation Home Loans / Pegasus Insight |
Profitability dipped slightly between Q3 2025 and Q1 2026, but remains high by historical standards, and landlord retention intent actually improved over the same window: 63% of landlords surveyed in Q1 2026 said they planned to remain in the sector, up from 58% in Q4 2025 (Foundation Home Loans/Pegasus Insight, Q1 2026). The gap between gross and net yield remains the real story for most individual landlords: after letting agent fees, void periods, repairs and legal/arrears cover, a typical PRS property can see roughly a quarter of gross rent absorbed by running costs before tax is even considered (NRLA case analysis, November 2025).
Confidence and Intentions
The NRLA's Landlord Confidence Index rose in every English and Welsh region in Q1 2026, up to an overall score of 30.3, its biggest single-quarter jump since Q3 2023 (NRLA, 2026). Read in isolation that sounds like a recovery. In context, it is not: 30.3 is still the second-lowest reading recorded since the index began tracking sentiment in 2019, meaning confidence has merely bounced off a record low rather than returned to healthy territory.
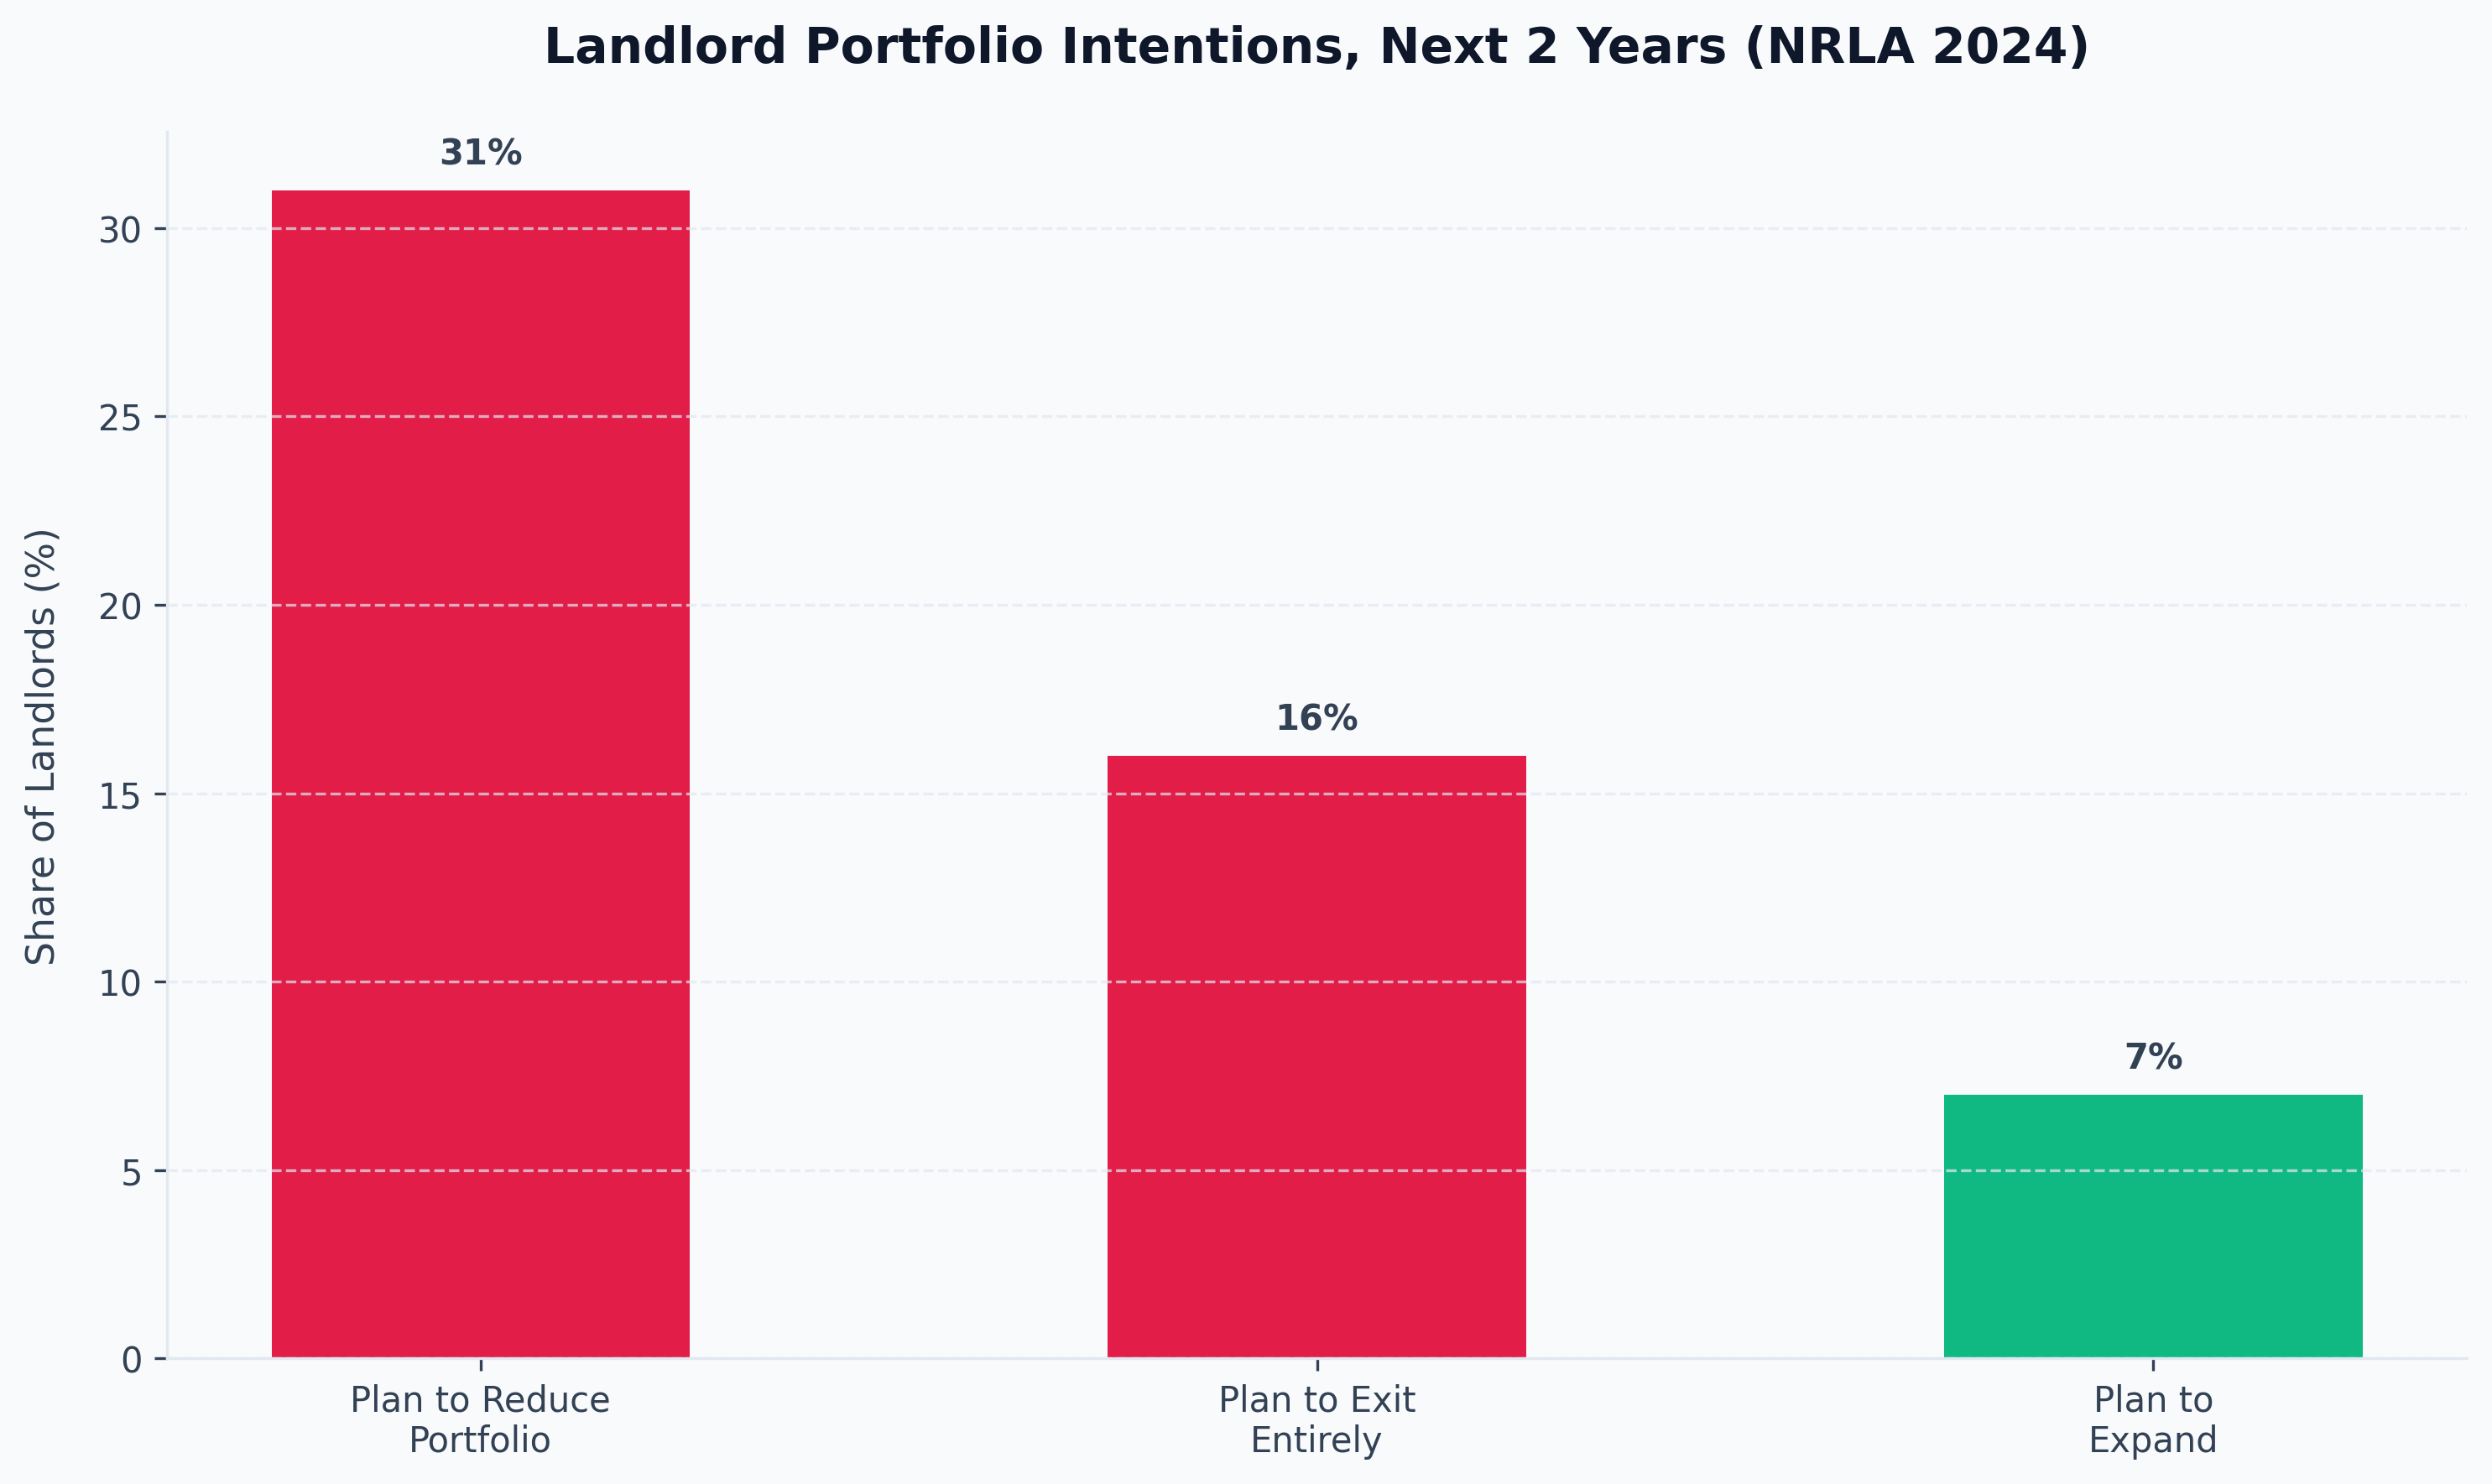
Underlying intentions confirm the split personality of the sector. In NRLA's 2024 member survey, 31% of landlords said they planned to reduce their portfolio over the following two years, including 16% planning to exit entirely, against just 7% planning to expand (down from 11% in 2021 and 12% in 2018). In Wales specifically, 47% of landlords said they were either planning to reduce their holdings or exit the market altogether, largely in response to proposed rent regulation and possession reforms.
The Landlord-to-Landlord Sales Data
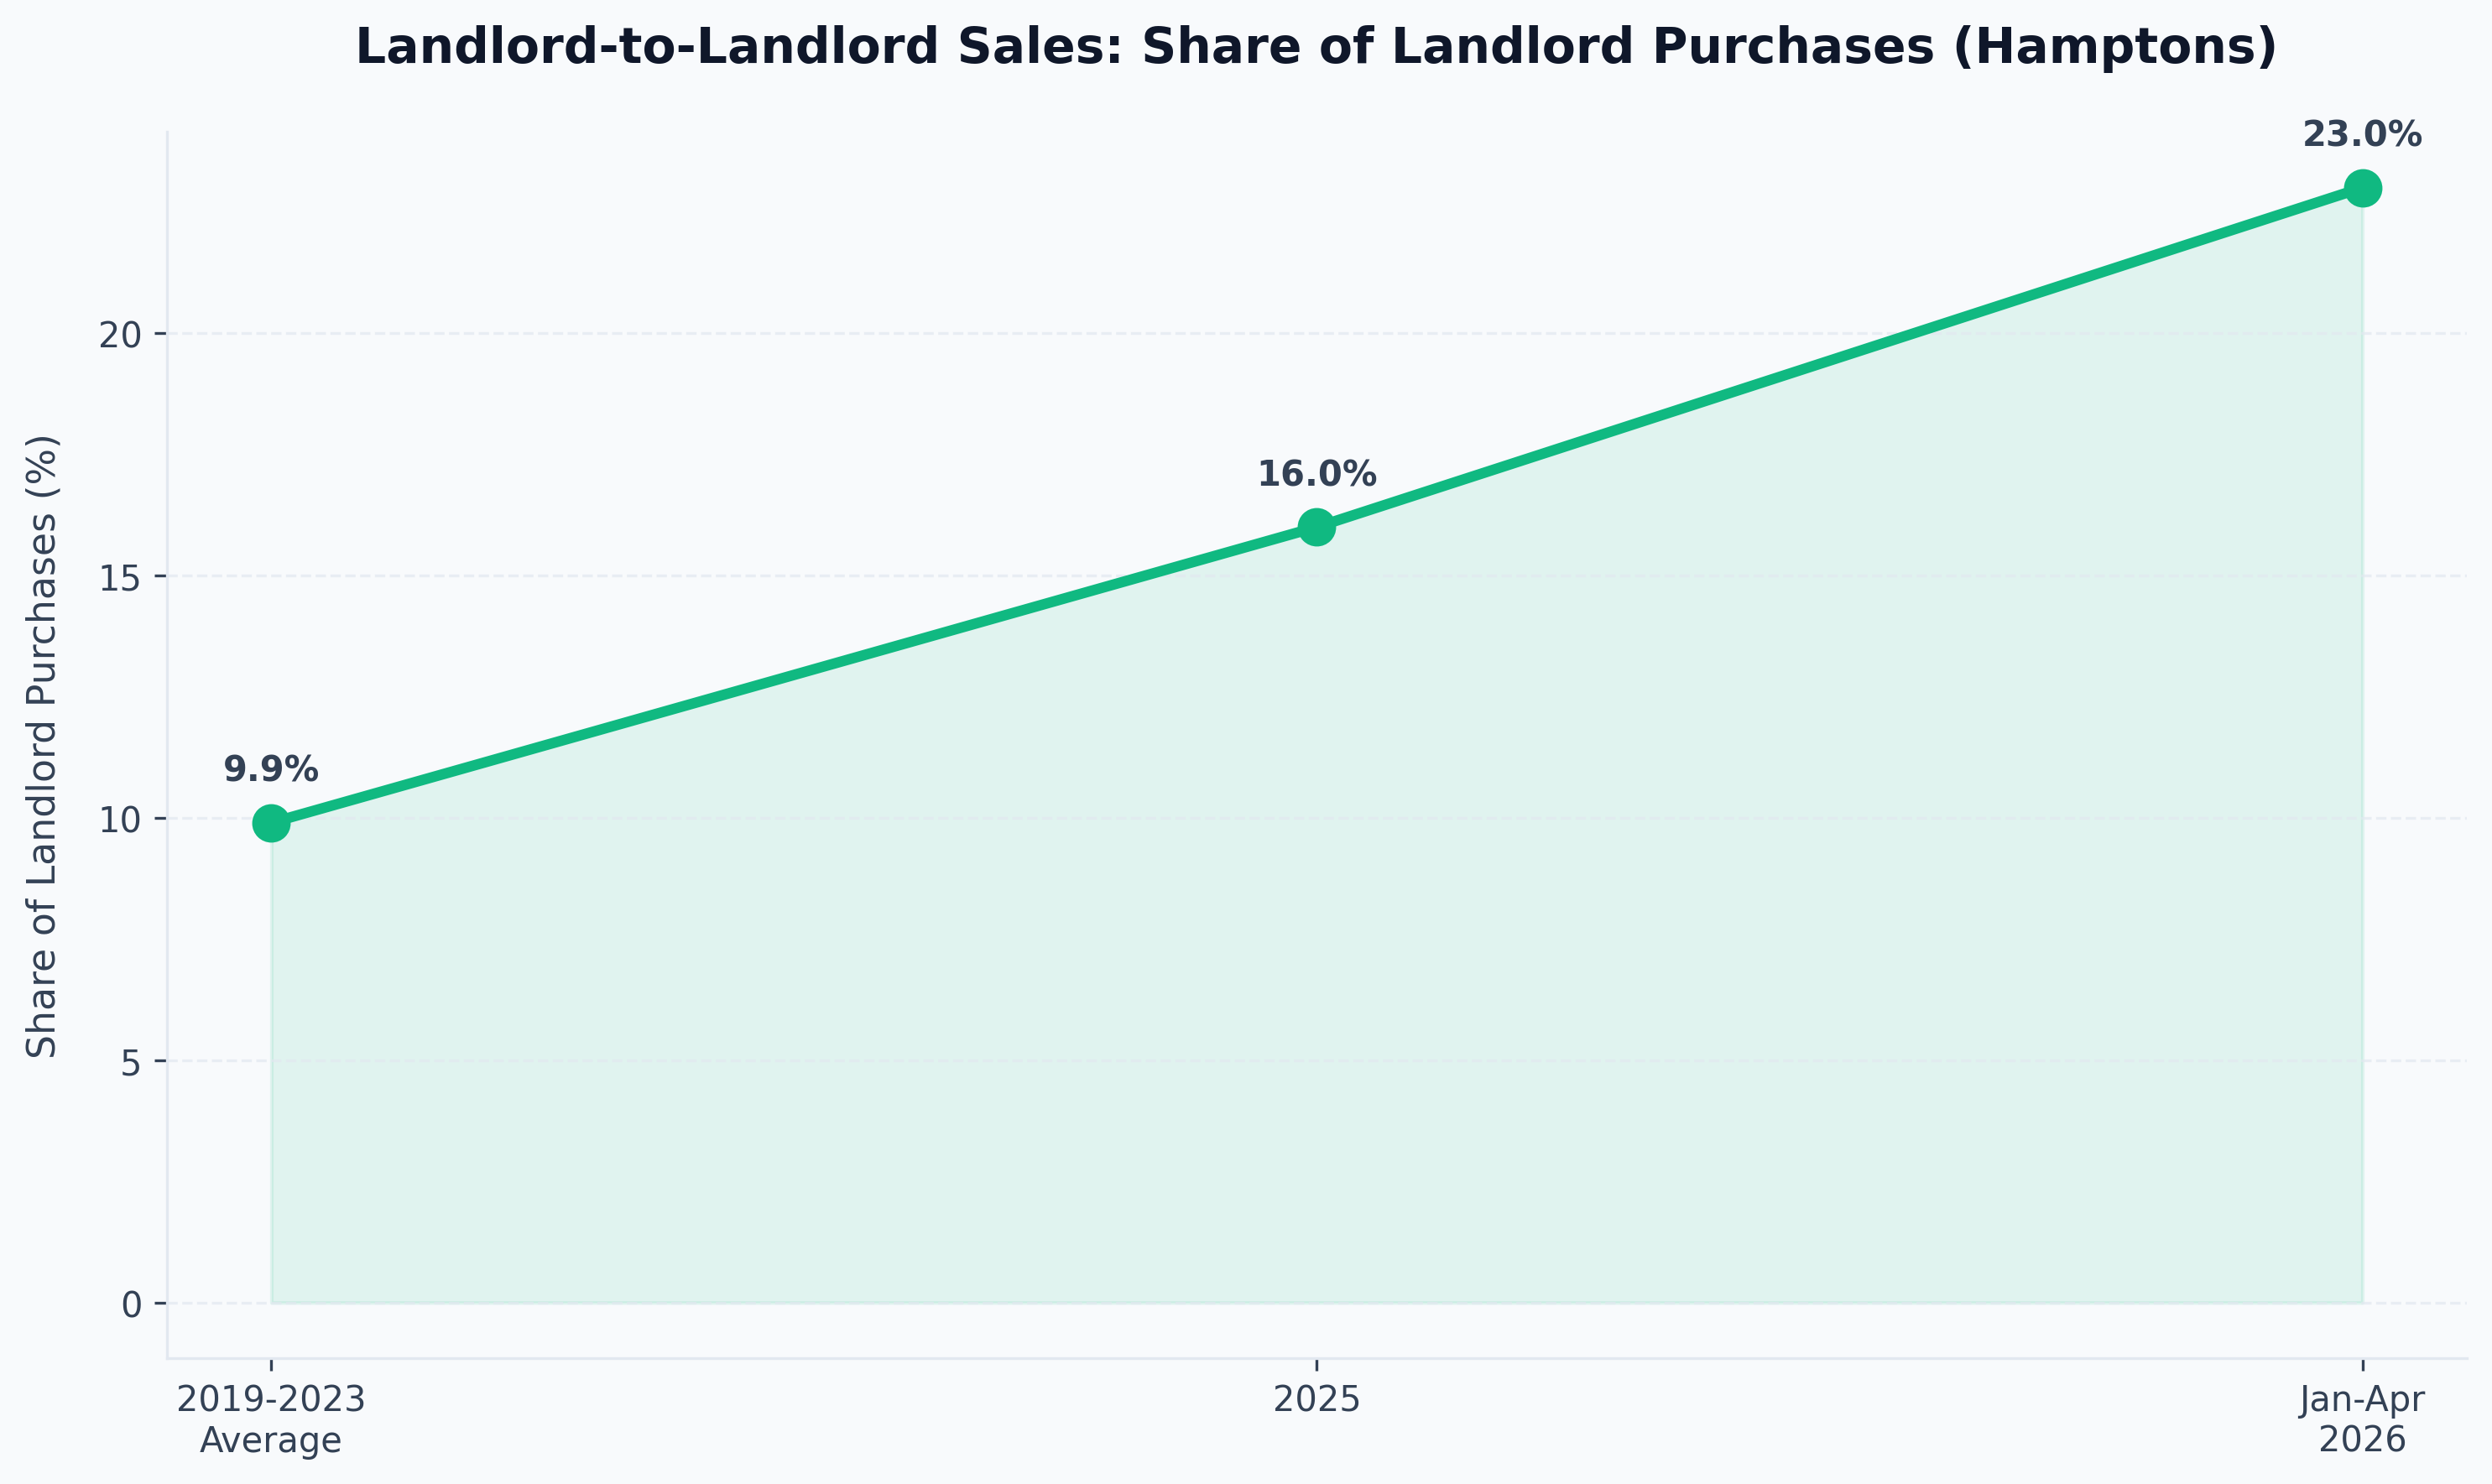
Hard transaction data, rather than survey sentiment, tells a more nuanced consolidation story. Landlords accounted for 13.3% of all Great Britain property purchases between January and April 2026, the highest share since 2016, and of those purchases, a record 23.0% had previously been let by another landlord, up from 16.0% in 2025 and a five-year (2019-2023) average of just 9.9% (Hamptons, using Connells Group data, 2026). In the North West specifically, landlord purchase share more than doubled year on year, from 12.4% in January-April 2025 to 25.3% in the same period of 2026.
The picture this paints is not a mass exodus from buy-to-let so much as consolidation: smaller, often self-managed landlords cashing out under regulatory and cost pressure, with their properties bought not by first-time residential buyers but by other, typically larger and better-capitalised, landlords.
EPC Compliance and the Net Zero Deadline
Current Landlord EPC Position (EPLS)
| Metric | Figure |
|---|---|
| Landlords with at least one property rated EPC D or below | 47% |
| Of those, planning to improve energy efficiency | 35% |
| Landlords expecting to spend up to £10,000 on upgrades | 34% |
| Landlords expecting to spend over £10,000 on upgrades | 11% |
| Private rented stock currently rated EPC A to C | 51% (up from 25% a decade ago) |
Regulatory Timeline and Penalties
| Milestone | Requirement |
|---|---|
| Since April 2020 | Illegal to let below EPC E (Minimum Energy Efficiency Standard) without a valid exemption |
| Current maximum penalty | Up to £5,000 per property, per breach |
| From 1 October 2030 | Minimum standard rises to the equivalent of EPC C (old EER methodology or new Home Energy Model) |
| From 1 October 2030 | Maximum penalty rises to £30,000 per property, per breach |
| Cost cap | Spending required capped at £10,000 per property, or 10% of property value for homes under £100,000 |
Nearly half of all landlords (47%) currently hold at least one sub-D property, and only around a third of those have firm upgrade plans, which suggests a meaningful compliance gap will need closing well before the 2030 deadline rather than in the final year or two. The cost distribution is telling too: most landlords face bills under £10,000 per property, but roughly one in nine face bills above that threshold, concentrated among older, solid-wall and off-gas-grid stock. Our dedicated guide to EPC upgrades for landlords breaks down upgrade costs by measure and property archetype.
The Renters' Rights Act: What Changed for Landlords in 2026
The Renters' Rights Act is the most significant piece of tenancy legislation to affect English landlords since the Housing Act 1988, and its core provisions are now live.
Key Dates
| Date | Event |
|---|---|
| 1 May 2026 | Act comes into force; Section 21 "no fault" eviction notices can no longer be served |
| 1 May 2026 | Existing assured shorthold tenancies automatically convert to assured periodic tenancies |
| 31 May 2026 | Deadline for landlords to issue the statutory Information Sheet and written statement of terms |
| 31 July 2026 | Deadline for concluding possession proceedings under Section 21 notices validly served before 1 May 2026 |
Serving an invalid Section 21 notice after 1 May 2026 now exposes a landlord to a civil penalty of up to £7,000 per breach (gov.uk/NRLA, 2026). Landlords who need to sell can still recover possession, but only via a dedicated ground requiring four months' notice, and it cannot be used within the first 12 months of a tenancy, a materially longer and more constrained process than the old Section 21 route.
For most landlords the practical change is procedural rather than existential: fixed terms have effectively disappeared for new and converted tenancies, and possession now requires a stated, evidenced ground rather than no reason at all. Our detailed breakdown, Renters' Rights Act for investors, covers the full list of possession grounds, rent increase procedures and the new Ombudsman/database requirements landlords must now meet.
BTL Mortgage Market: Rates, Lending and Arrears
Lending and Product Availability
| Metric | Figure | Source |
|---|---|---|
| New BTL lending, 2025 | £11 billion (+11% YoY) | UK Finance |
| New BTL lending forecast, 2026 | ~£11 billion (broadly flat) | UK Finance |
| BTL mortgage products available, April 2026 | 5,529 (highest so far in 2026) | Moneyfacts/Which? |
| Average 2-year fixed BTL rate, 1 March 2026 | 4.66% | Which?/industry rate trackers |
| Average 2-year fixed BTL rate, 1 April 2026 | 5.44% | Which?/industry rate trackers |
Arrears and Possessions, Q1 2026
| Metric | Q1 2026 Figure | Change |
|---|---|---|
| BTL mortgages in arrears (2.5%+ of balance) | 8,960 | -6% vs Q4 2025 |
| BTL arrears as % of all BTL mortgages | 0.47% | Low by historical standards |
| BTL properties taken into possession | 810 | +5% vs Q4 2025, still below long-term average |
Despite the sharp jump in average two-year fixed rates between March and April 2026 (driven by swap-rate volatility around the spring Budget period), actual mortgage distress remains contained: arrears fell quarter on quarter and sit at under half a percent of the book, while possessions, though up slightly, remain below their long-run historical average. Lender appetite has also held up, with product choice at its highest point of the quarter in April 2026. Full lending-volume history and rate-by-product detail is covered in UK buy-to-let statistics 2026.
What This Means for Investors
The data paints a sector that is consolidating, not collapsing. A shrinking pool of self-managed, smaller landlords is selling to a growing pool of incorporated, professionally-managed portfolio operators, and the regulatory and compliance burden (Renters' Rights Act, EPC 2030, Making Tax Digital from April 2026) is accelerating that shift rather than reversing it.
For an investor entering or expanding in 2026, three implications follow directly from the numbers above:
- Structure matters from day one. With 75-80% of new BTL purchases now going through limited companies and incorporations still rising, starting in personal name and converting later adds transfer costs (stamp duty, capital gains, refinancing) that a same-year decision avoids. Read our limited company buy-to-let guide before your first purchase, not after.
- Yield claims need a source check. The 2.3-point gap between Zoopla's full-market yield figure and Fleet Mortgages' lender-completion figure for the same country in the same quarter shows how easily "average yield" can be quoted out of context. Ask any source for its underlying population before using a yield figure to underwrite a deal.
- Consolidation creates acquisition opportunity. With landlord-to-landlord sales at a record 23% share and smaller landlords exiting under compliance pressure, off-market and semi-distressed stock is increasingly available through structured channels. This is precisely the deal flow that property sourcing companies are built to surface, and it rewards investors who can move with cash or pre-approved finance. Shaded Canvas works directly with investors on this basis; see how we structure UK property investment for current opportunities.
Risk Notes
- Regulatory risk is now continuous, not one-off. The Renters' Rights Act, EPC 2030 standard, Making Tax Digital (April 2026) and the proposed rental income surcharge (April 2027) stack on top of each other; treat compliance as an ongoing cost line, not a single adjustment.
- Rate volatility can move faster than portfolios can react. The jump in average 2-year fixed BTL rates from 4.66% to 5.44% in a single month (March to April 2026) shows refinancing risk remains live even in a "stabilising" rate environment.
- Regional yield figures are not interchangeable across sources. Using a lender's book-weighted yield figure to underwrite a standard AST purchase, or vice versa, will misstate expected income; always match the yield source to the property type being purchased.
- Portfolio concentration cuts both ways. The 17% of landlords who hold 49% of tenancies benefit from economies of scale, but also carry proportionally larger exposure to any single regulatory or market shock; diversification across region and tenancy type remains a genuine risk control, not just a platitude.
- EPC exemption reliance is a growing tail risk. With the bar rising to EPC C-equivalent from October 2030 and penalties rising to £30,000 per breach, properties currently relying on exemptions rather than genuine upgrades face a hard compliance cliff, not a gradual one.
Actionable Next Steps
- Audit your own portfolio against the national EPC data. If any property sits at D or below, get a fresh EPC assessment and a costed upgrade plan now rather than waiting for the 2030 deadline to concentrate demand (and price) for tradespeople.
- Decide on structure before your next purchase, not after. If you are still buying in personal name and paying higher-rate tax on rental profit, model the limited company alternative using our limited company buy-to-let guide before completing.
- Re-read your tenancy paperwork against the Renters' Rights Act deadlines. Confirm any pre-1 May 2026 Section 21 notices are on track to conclude possession proceedings by 31 July 2026, and that the statutory Information Sheet has gone out to every tenant.
- Cross-check any yield figure you are quoted against its source population. Ask whether a quoted yield is full-market (Zoopla-style) or lender-completion (Fleet-style) data before using it to compare locations.
- If you are considering selling, benchmark against the landlord-to-landlord data. With other landlords now the buyer in a record share of transactions, a direct sale to a portfolio investor may realise a faster, cleaner exit than a retail listing, particularly for tenanted stock.
- Talk to a structured acquisition partner if you are looking to redeploy capital. Shaded Canvas works with investors navigating exactly this consolidation phase of the market.
FAQ
How many landlords are there in the UK in 2026? There are approximately 2.82 million private landlords in England, according to the English Private Landlord Survey and English Housing Survey (gov.uk). This figure has been broadly stable since the 2021 survey, even as the total number of privately rented households has plateaued at around 4.7 million.
What percentage of UK landlords own just one property? 45% of landlords own a single rental property, and 83% own between one and four properties in total (English Private Landlord Survey 2024). Despite being the large majority by headcount, these smaller landlords account for only 51% of tenancies, because the remaining 17% of landlords with five or more properties control the other 49%.
Are UK landlords actually making a profit in 2026? Yes, though the margin is thinner than gross yield figures suggest. 84% of buy-to-let landlords reported profitable operations in Q1 2026 against an average yield of 6.5% (Foundation Home Loans/Pegasus Insight), while typical running costs, letting agent fees, voids, repairs and legal cover, can absorb around a quarter of gross rent before tax.
Are landlords selling up or expanding their portfolios? Both, simultaneously. NRLA's 2024 survey found 31% of landlords planning to reduce their portfolio (including 16% planning a full exit) against just 7% planning to expand, yet hard transaction data shows landlords accounted for a record 13.3% of all property purchases between January and April 2026 (Hamptons). The net effect is consolidation: smaller landlords selling, larger ones buying.
How has the Renters' Rights Act changed things for landlords? The Act came into force on 1 May 2026, abolishing Section 21 "no fault" evictions and automatically converting existing assured shorthold tenancies into periodic tenancies. Landlords can still recover possession to sell, but must give four months' notice and cannot use that ground within a tenancy's first 12 months, a materially slower process than before.
What proportion of UK landlords now operate through a limited company? A record 66,587 new buy-to-let companies were incorporated in 2025 alone, bringing the total active buy-to-let companies on the Companies House register to 443,272, up from 92,975 in February 2016 (Hamptons research). Industry estimates put 75-80% of new BTL purchases as being made via limited company structures rather than in personal name.
Do UK landlords need to worry about EPC compliance right now? Yes. 47% of landlords currently have at least one property rated EPC D or below, and only 35% of those have firm plans to upgrade it (English Private Landlord Survey). With the minimum standard rising to the equivalent of EPC C from 1 October 2030 and penalties increasing to £30,000 per breach, the compliance gap needs closing well ahead of the deadline, not in the final year.
Sources: English Private Landlord Survey 2024 and English Housing Survey (gov.uk/MHCLG); UK Finance mortgage arrears, possessions and lending data (2025-2026); National Residential Landlords Association (NRLA) Landlord Confidence Index and member surveys; Hamptons research using Companies House and Connells Group data; Zoopla regional yield analysis (2026); Fleet Mortgages Buy to Let Index (Q1 2026); Pegasus Insight Landlord Trends / Foundation Home Loans (Q3 2025, Q1 2026); Moneyfacts/Which? mortgage product data. All figures independently verified against named sources as of July 2026.
Stop being a landlord. Start being an investor.
Shaded Canvas introduces serious capital to vetted UK property opportunities — targeting 12–16% net returns.
Start Investing →