

The UK rental market is at a structural inflection point. After three years of intense tenant competition and double-digit rent rises, the market is rebalancing — but supply remains 23–33% below pre-pandemic levels and affordability is stretched to breaking point. This page consolidates every critical rental market statistic for 2026, from tenant demographics and rent-to-income ratios to supply dynamics, Build-to-Rent growth, and the impact of the Renters' Rights Act.
Whether you are a tenant benchmarking your rent, an investor analysing demand, or a policymaker tracking housing affordability, this is the definitive reference.
Last Updated: April 2026 | Next Update: July 2026
Key Rental Market Statistics at a Glance
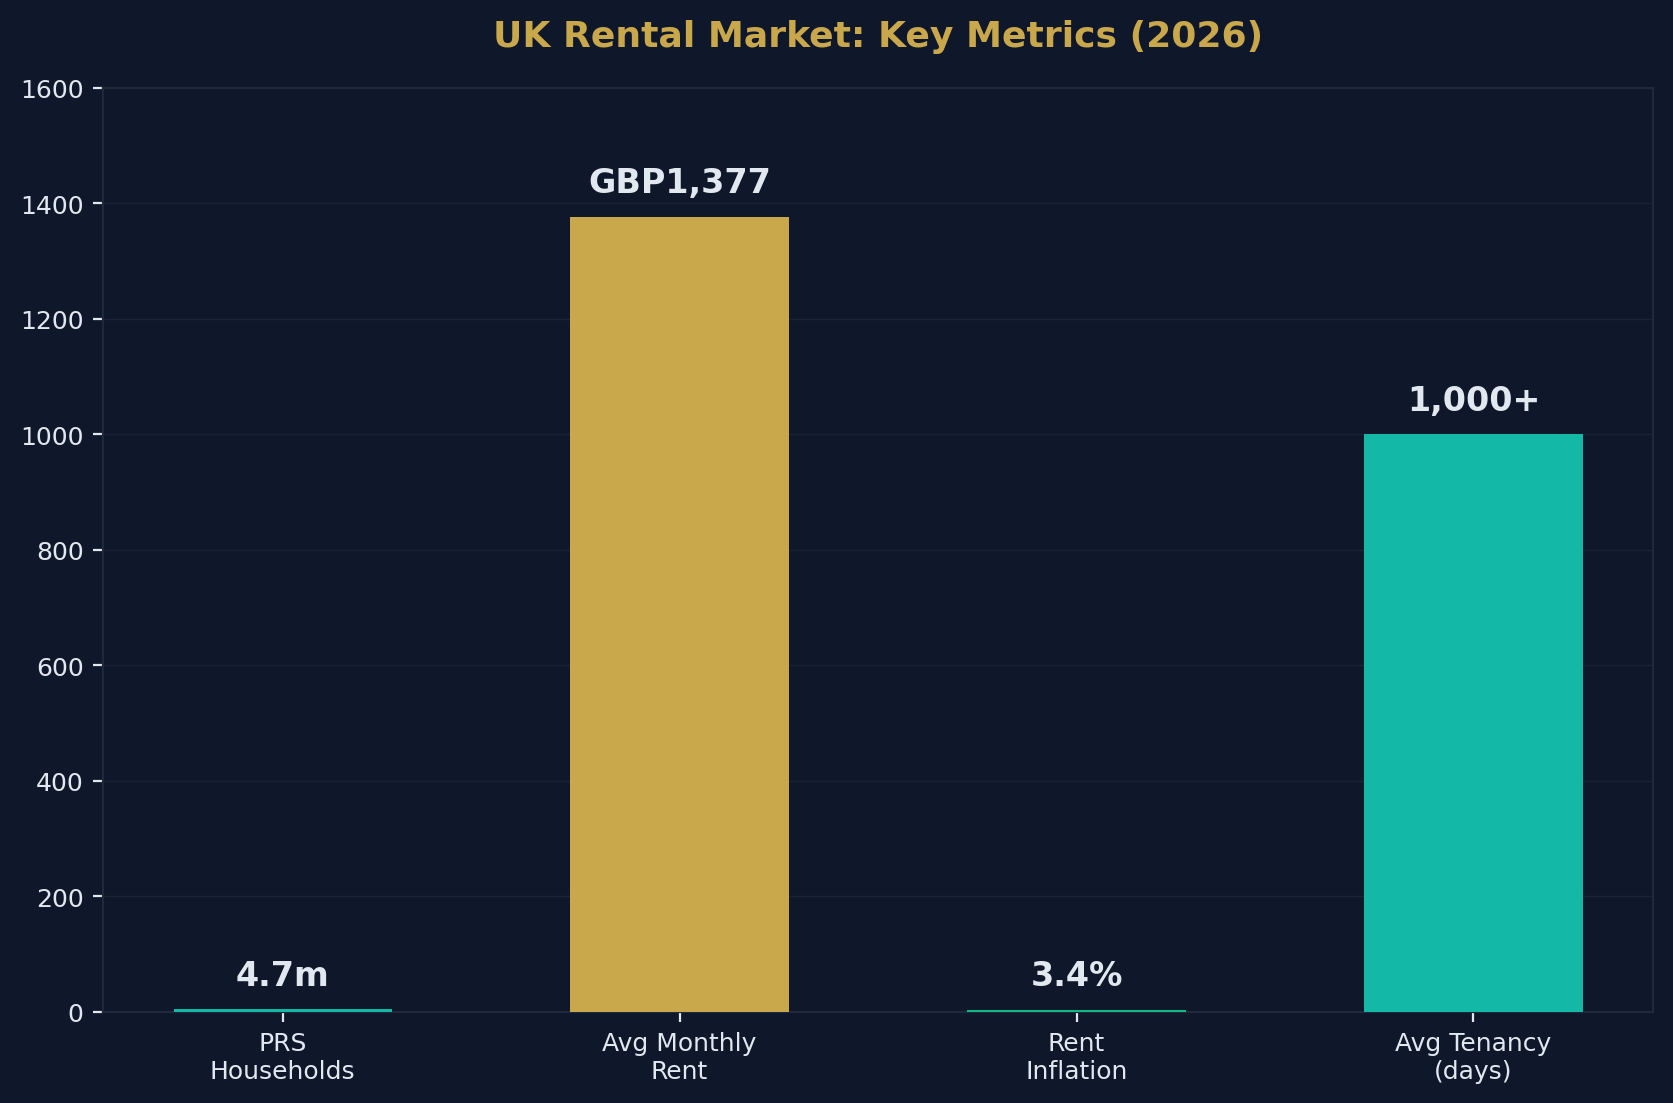
- There are approximately 4.7 million privately rented households in England.
- The average UK monthly private rent is £1,377 (ONS, March 2026).
- Annual rent inflation has decelerated to 3.4% — the lowest since March 2022.
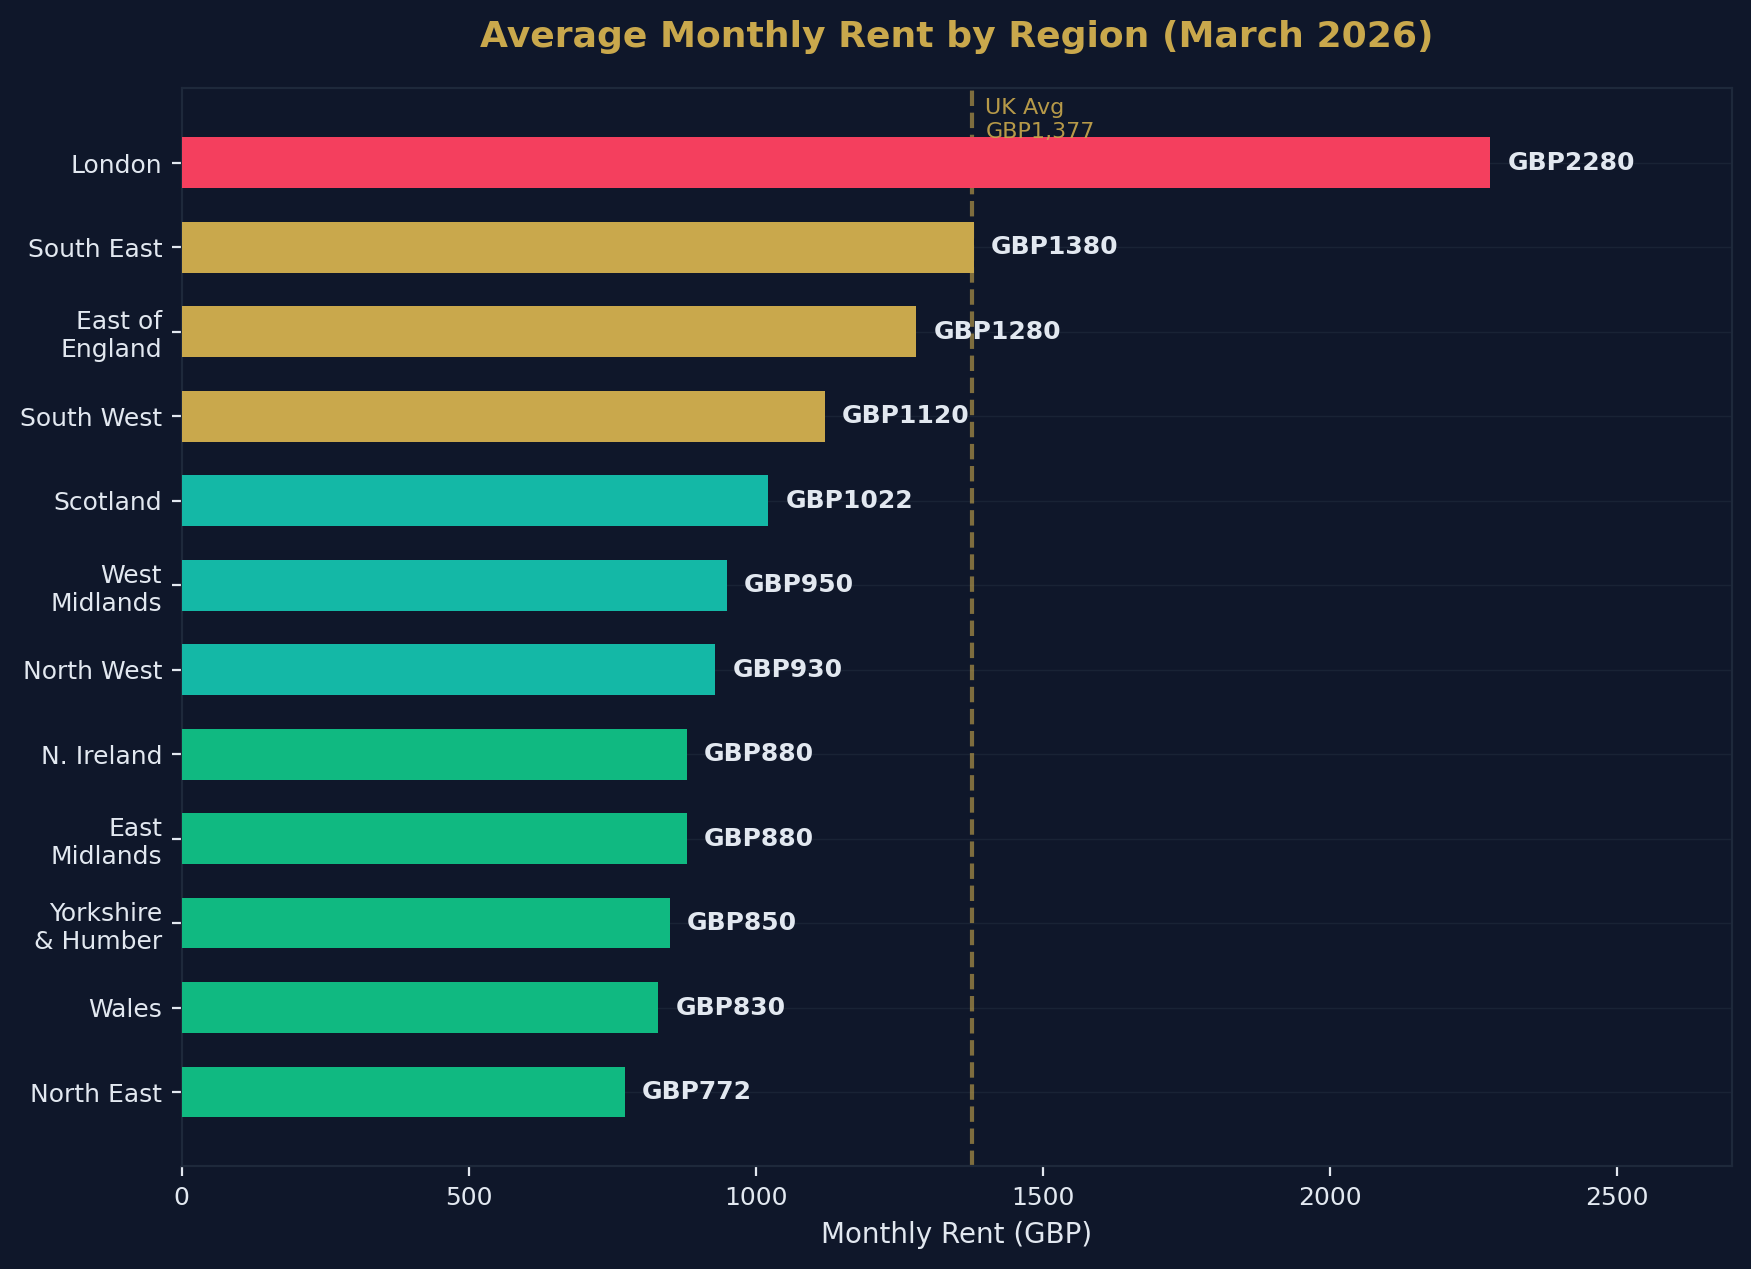
- London rents average £2,280/month; North East rents average £772/month.
- The average UK renter spends 41% of take-home pay on rent.
- London renters spend 48% of take-home pay on rent.
- The average tenancy length in England & Wales is 1,000+ days (~2.7 years).
- Rental stock remains 23–33% below pre-pandemic levels.
- Enquiries per rental property have fallen to ~4.8 — down from 8+ in 2022 but double the 2019 average.
- 26% of rental listings now require price reductions to attract tenants.
- Build-to-Rent investment reached £5.3 billion in 2025, projected at £5.7bn for 2026.
- BTR occupancy rates average ~97%.
- The Renters' Rights Act takes effect 1 May 2026 — abolishing Section 21 evictions.
- Savills forecasts cumulative rental growth of 12% over 2026–2030.
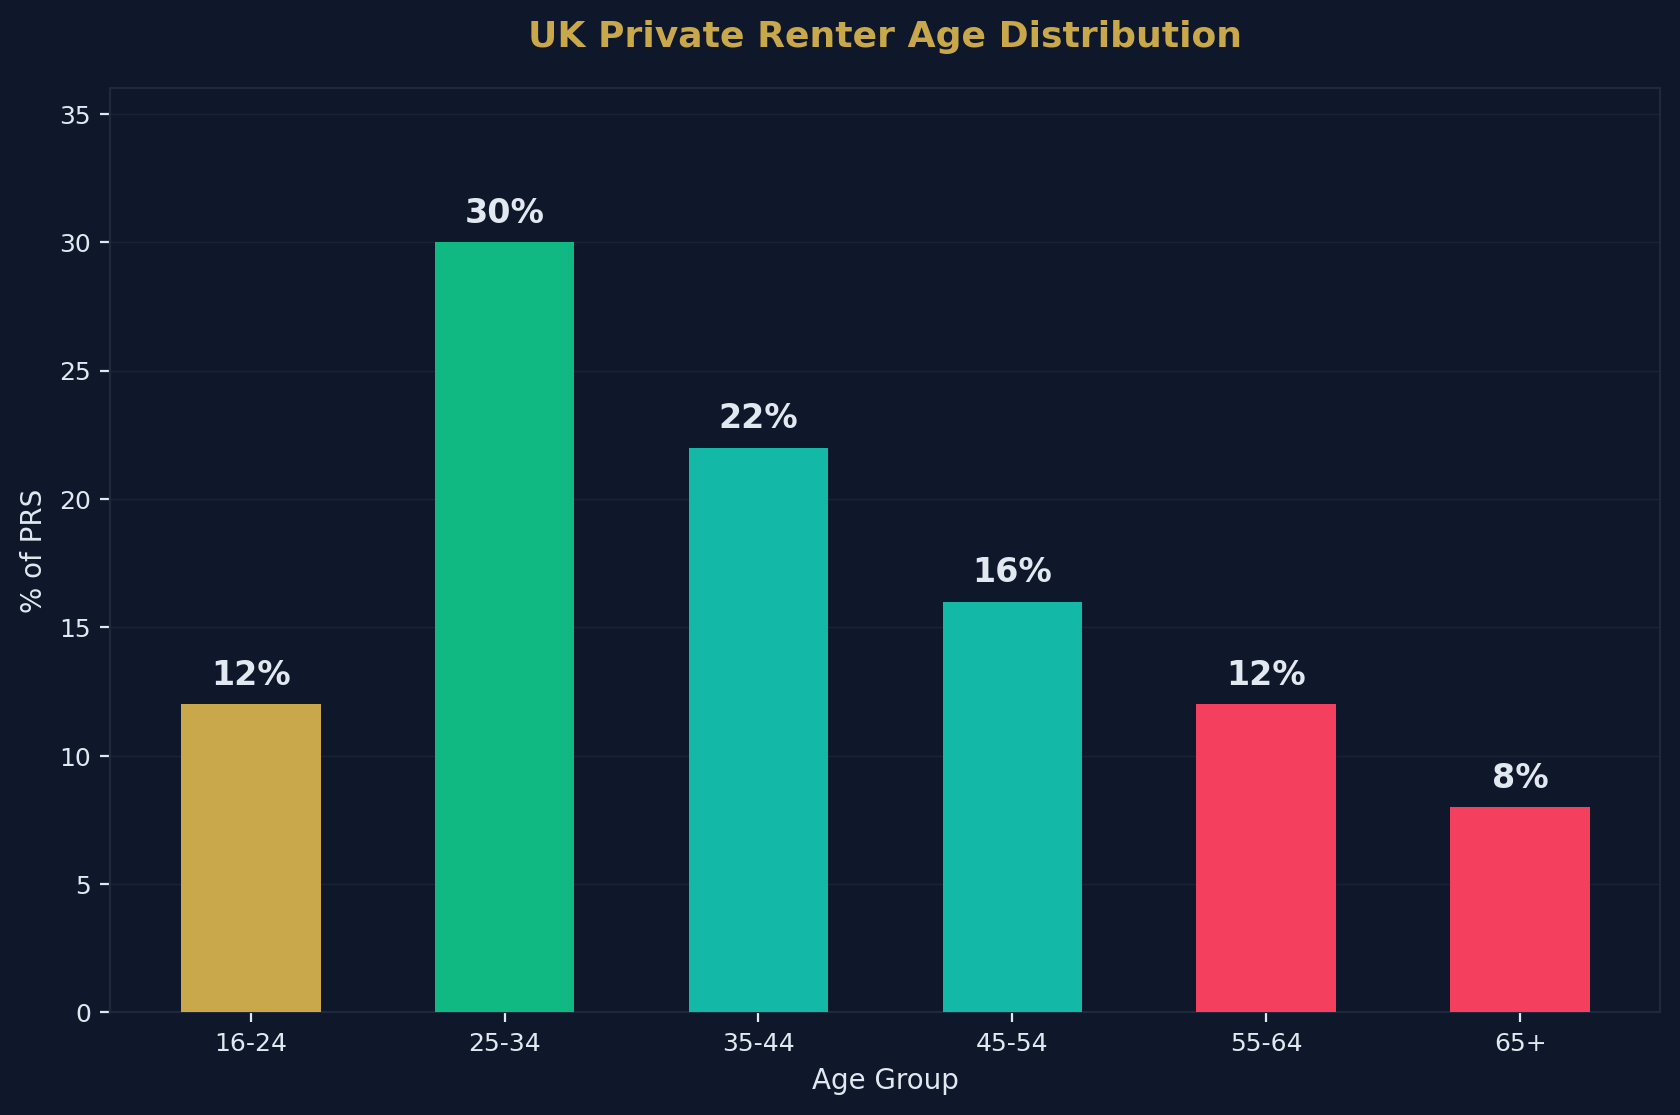
- Renters aged 25–34 remain the largest demographic group in the PRS.
- Renters aged 55+ are the fastest-growing demographic — now 1 in 5 private renters.
Source: Shaded Canvas analysis of ONS, Zoopla, Rightmove, English Housing Survey, and Savills data. Last updated April 2026.
Average Rent by Region
ONS Private Rental Index (March 2026)
| Region | Average Monthly Rent | Annual Change |
|---|---|---|
| London | £2,280 | +1.7% |
| South East | £1,380 | +2.8% |
| East of England | £1,280 | +3.2% |
| South West | £1,120 | +3.8% |
| West Midlands | £950 | +4.5% |
| East Midlands | £880 | +4.8% |
| North West | £930 | +4.2% |
| Yorkshire & Humber | £850 | +5.2% |
| North East | £772 | +6.5% |
| Wales | £830 | +4.8% |
| <a href="/post/invest-in-scotland-property" style="color:#c9a84c;text-decoration:underline;font-weight:500">Scotland | £1,022 | +2.1% |
| Northern Ireland | £880 | +5.0% |
| UK Average | £1,377 | +3.4% |
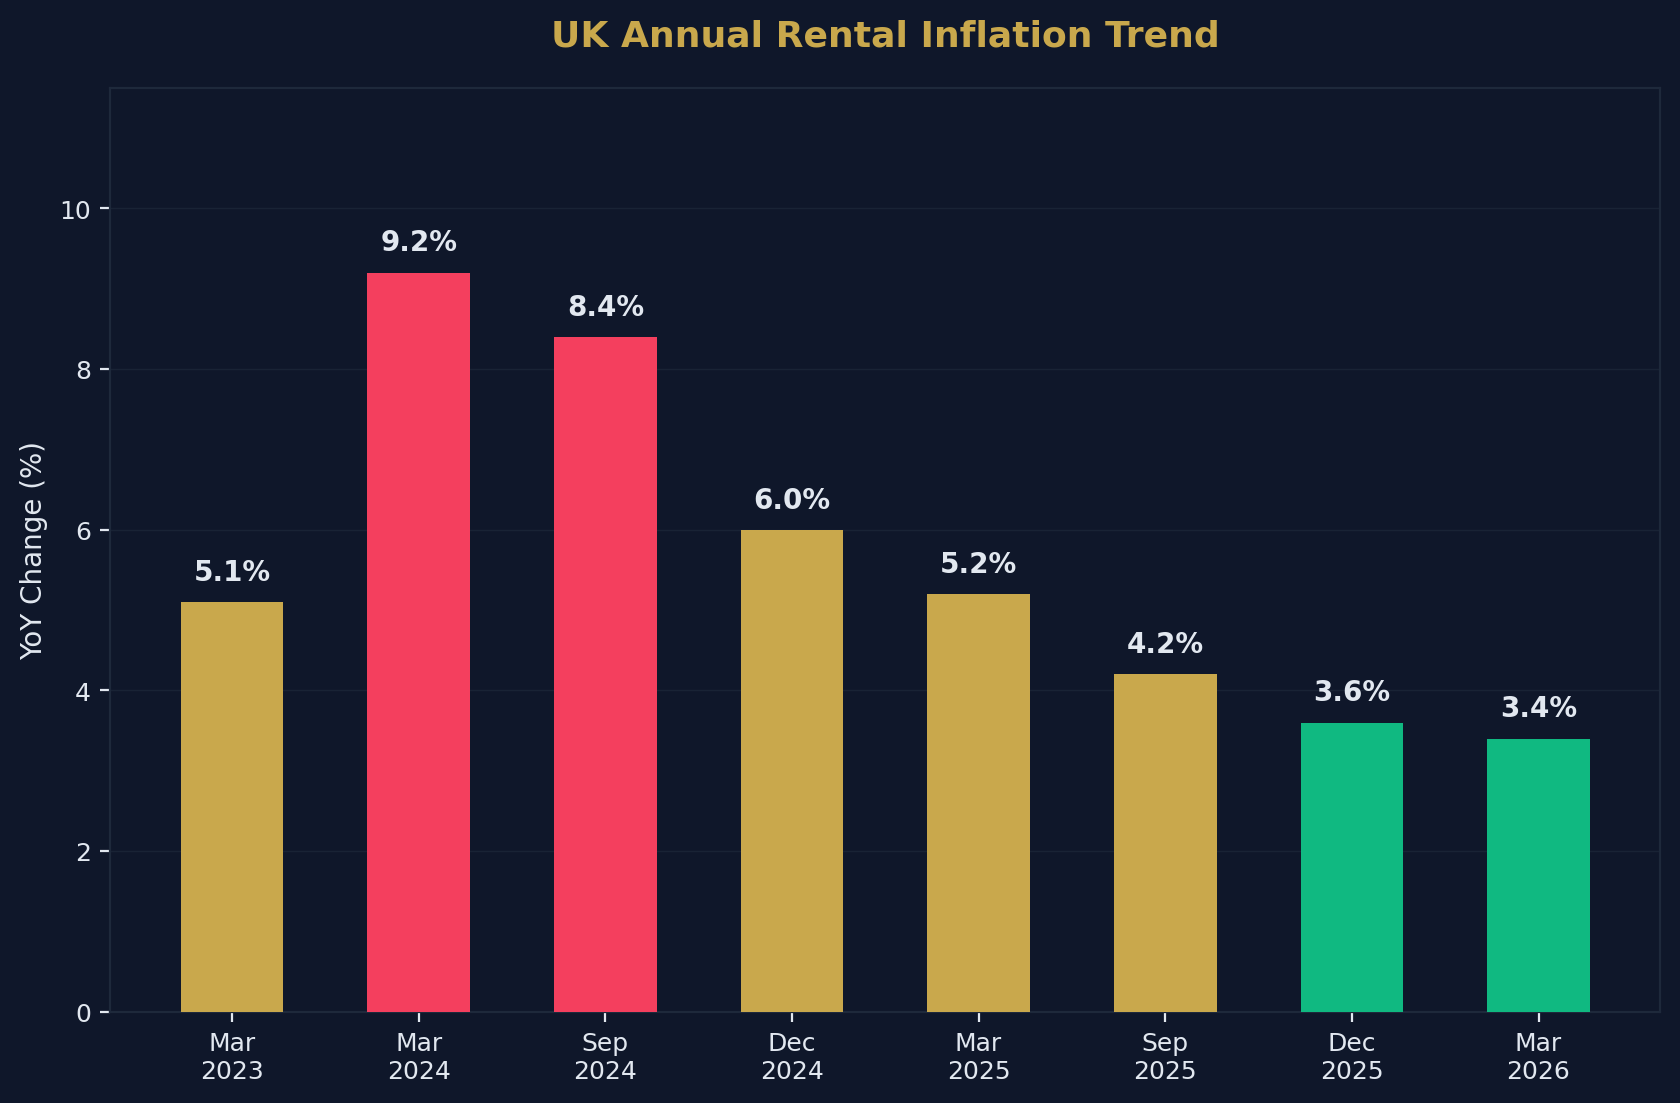
Rental Inflation: The Deceleration Story
Annual rent inflation has fallen sharply from its peak:
| Period | Annual Rent Inflation |
|---|---|
| March 2023 | 5.1% |
| March 2024 | 9.2% |
| September 2024 | 8.4% |
| December 2024 | 6.0% |
| March 2025 | 5.2% |
| September 2025 | 4.2% |
| December 2025 | 3.6% |
| March 2026 | 3.4% |
The deceleration is driven by three factors:
- Affordability ceiling: Tenants in many areas simply cannot absorb further increases
- Reduced net migration: Lower inbound migration has eased demand pressure
- Improved supply: Modest increase in available listings (3–11% YoY)
Tenant Demographics
Who Rents in the UK?
| Age Group | Share of PRS | Trend |
|---|---|---|
| 16–24 | ~12% | Declining share |
| 25–34 | ~30% | Largest group (stable) |
| 35–44 | ~22% | Growing |
| 45–54 | ~16% | Growing |
| 55–64 | ~12% | Fastest growth |
| 65+ | ~8% | Fastest growth |
The Ageing of the PRS
The most significant demographic shift is the rapid growth of older renters:
- 1 in 5 private renters is now aged 55+
- The over-55 cohort has grown faster than any other age group over the past decade
- Many older renters are former homeowners who have divorced, downsized, or experienced financial difficulty
- This group is more likely to be long-term renters with tenancies exceeding 5 years
This trend has profound implications for the sector: older renters need more stable, accessible, long-term housing — yet the regulatory framework and <a href="/post/uk-buy-to-let-statistics-2026" style="color:#c9a84c;text-decoration:underline;font-weight:500">landlord behaviour still primarily cater to younger, more transient tenants.
Rental Affordability
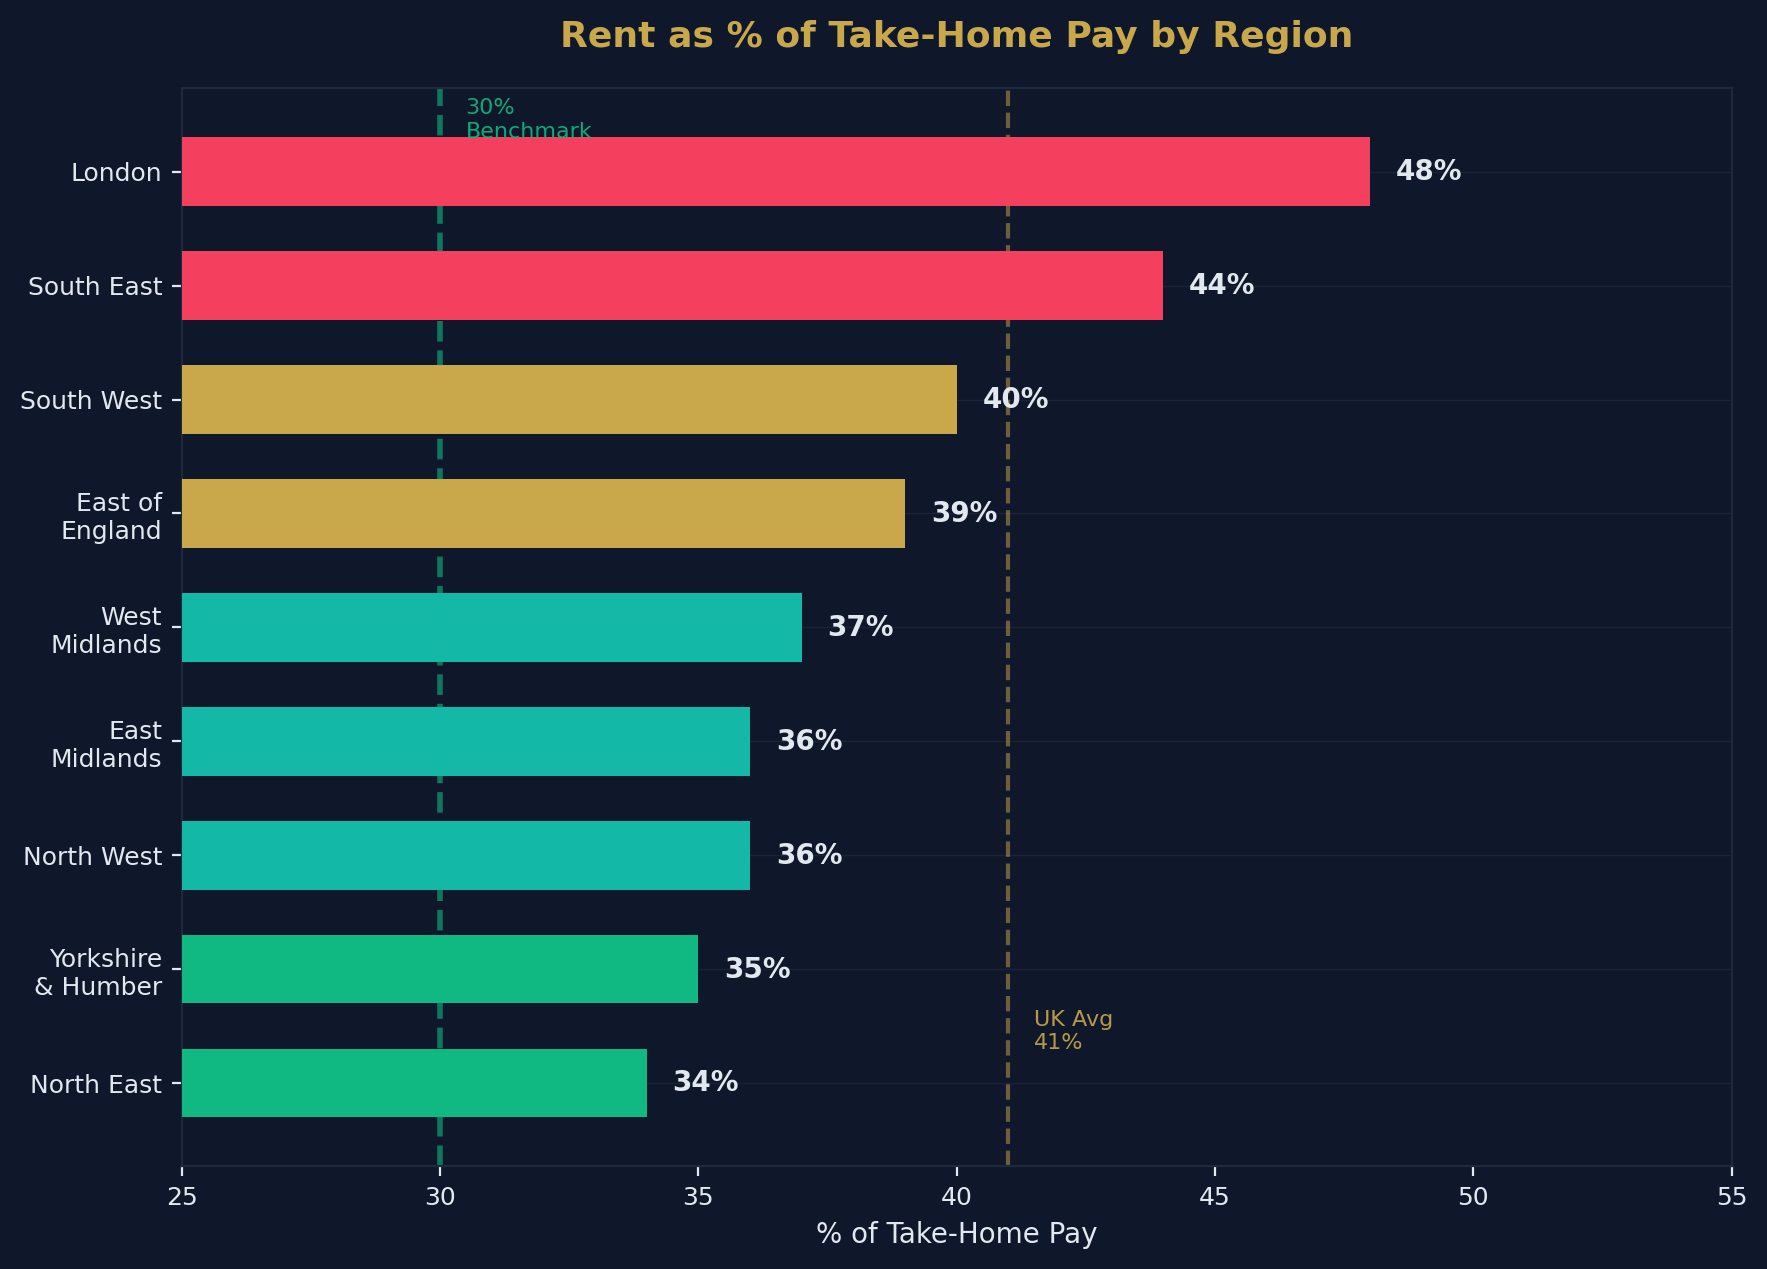
Rent-to-Income Ratio by Region
| Region | Rent as % of Take-Home Pay |
|---|---|
| London | 48% |
| South East | 44% |
| South West | 40% |
| East of England | 39% |
| West Midlands | 37% |
| East Midlands | 36% |
| North West | 36% |
| Yorkshire & Humber | 35% |
| North East | 34% |
| UK Average | 41% |
The 30% Threshold
The widely accepted affordability benchmark is that housing costs should not exceed 30% of household income. By this measure:
- Every UK region now exceeds the 30% threshold for average renters
- London exceeds it by 18 percentage points (48%)
- The lowest-income renters spend 50–63% of their income on rent
- This creates a squeeze on food, transport, savings, and mental health
Impact on Saving
For a renter in London earning £35,000 (take-home ~£2,400/month):
- Rent (average room): £1,150/month (48%)
- Bills & council tax: £250/month
- Transport: £200/month
- Food: £300/month
- Remaining for savings: £500/month — making a first-time buyer deposit of £120,000 require 20 years of saving
Supply and Demand Balance
Available Rental Stock
| Metric | 2019 (Pre-COVID) | 2022 (Peak Crisis) | Early 2026 |
|---|---|---|---|
| Available listings (index) | 100 | 55 | 67–77 |
| Enquiries per property | 2.5 | 8–12 | 4.8 |
| Average days to let | 25 | 14 | 20 |
| Listings requiring price cuts | 10% | 3% | 26% |
The Supply Gap
Despite modest improvement, rental supply remains 23–33% below pre-pandemic levels. The causes are structural:
- Landlord exits: An estimated 220,000 households will leave the PRS by end of 2026
- Undersupply of new homes: Only ~220,000 net additions vs 300,000 target
- Regulatory deterrence: New regulations discouraging new entrants
- Stamp duty surcharge: 5% surcharge on BTL purchases raises entry barriers
The professional investors absorbing this exiting stock increasingly rely on property sourcing tools to surface off-market opportunities at scale.
Build-to-Rent (BTR) Sector
BTR Market Overview
| Metric | Figure |
|---|---|
| Total BTR investment (2025) | £5.3 billion |
| Projected BTR investment (2026) | £5.7 billion |
| Average BTR occupancy rate | ~97% |
| BTR pipeline (completed + under construction) | ~100,000+ units |
| BTR share of total PRS | ~2% |
Why BTR Matters
Build-to-Rent is the fastest-growing segment of the PRS. While still representing only ~2% of total stock, it offers:
- Professional management: Higher service standards, dedicated on-site teams
- Long-term security: Designed for long tenancies, pet-friendly policies
- Amenities: Gyms, co-working spaces, communal gardens
- Institutional backing: Pension funds and REITs providing stable, long-term investment
The BTR sector is filling the gap left by departing amateur landlords — but at a premium price point that limits accessibility for lower-income tenants.
The Renters' Rights Act
Key Provisions (Effective 1 May 2026)
| Provision | Impact |
|---|---|
| Section 21 abolition | No more "no-fault" evictions |
| All tenancies become periodic | No fixed-term contracts; tenants can leave with 2 months' notice |
| Pet rights | Tenants can request pets; landlords cannot unreasonably refuse |
| Rent increases | Limited to once per year via market rent assessment |
| Decent Homes Standard | Extended to private rented sector |
| Private rented sector ombudsman | Mandatory landlord registration |
Market Impact Assessment
| Effect | Short-Term | Medium-Term |
|---|---|---|
| Tenant security | Significantly improved | Structural improvement |
| Landlord exits | Accelerated (uncertainty) | Stabilised (adaptation) |
| Rent levels | Potential upward pressure | Market-determined |
| Supply | Minor contraction risk | Recovery as clarity improves |
| Professionalisation | Accelerated | Industry standard |
Tenancy Length Trends
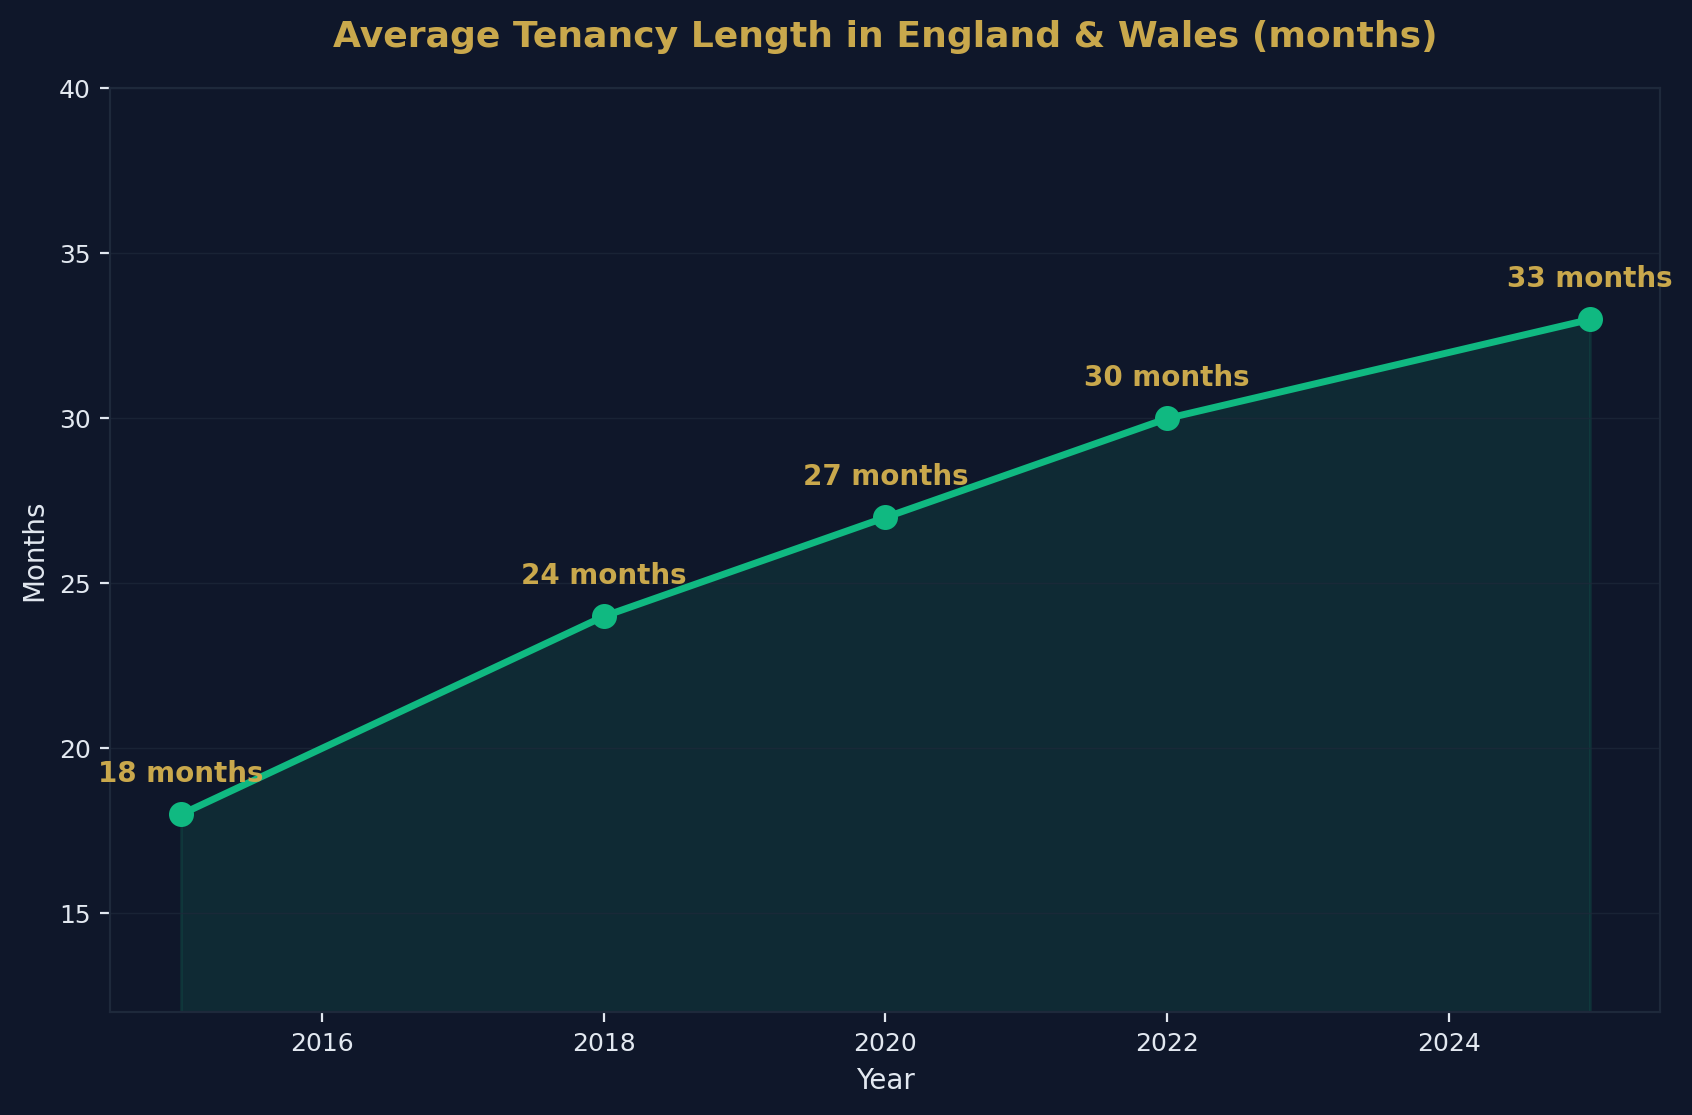
Average Tenancy Duration
| Period | Average Tenancy Length |
|---|---|
| 2015 | ~18 months |
| 2018 | ~24 months |
| 2020 | ~27 months |
| 2022 | ~30 months |
| 2025 | ~33 months (1,000+ days) |
Tenancy lengths have increased steadily, driven by:
- Cost of moving: High rents make relocation expensive
- Competition fear: Tenants worry about finding suitable alternatives
- Rising deposits: New deposits require significant upfront cash
- Regulatory changes: The shift to periodic tenancies encourages stability
Methodology and Data Sources
| Source | Data Type | Coverage |
|---|---|---|
| ONS PIPR | Rents, rental inflation | UK nations & regions |
| English Housing Survey | Tenure, demographics, affordability | England |
| Zoopla Rental Market Report | Supply, demand, yields | UK cities & postcodes |
| Rightmove | Listings, time to let | UK |
| Savills | Forecasts, BTR data | UK |
| DLUHC | Housing policy, regulation | England |
How to Cite This Page
UK Rental Market Statistics 2026. Shaded Canvas. Published April 2026, updated quarterly. Available at: https://blog.shadedcanvas.co.uk/post/uk-rental-market-statistics-2026
Stop being a landlord. Start being an investor.
Shaded Canvas introduces serious capital to vetted UK property opportunities — targeting 12–16% net returns.
Start Investing →