Getting on the property ladder in the UK has never been straightforward, but the data tells a more nuanced story than headlines suggest. This page consolidates every critical first-time buyer statistic for 2026 — from average ages and deposits to regional affordability ratios and mortgage approval trends — sourced from the ONS, UK Finance, Bank of England, HM Land Registry, and leading lenders.
Whether you are a first-time buyer planning your purchase, a policy researcher analysing affordability, or a journalist reporting on the housing crisis, this is the definitive reference.
Last Updated: April 2026 | Next Update: July 2026
Key First-Time Buyer Statistics at a Glance
- The average age of a first-time buyer in the UK is 33.9 years.
- The average FTB house price nationally is £226,000 (January 2026).
- The average FTB deposit nationally is £60,000–£64,000.
- The average FTB deposit in London exceeds £120,000.
- The national house price-to-earnings ratio for FTBs is 4.7x — below the 20-year average for the first time since 2020.
- Approximately 390,000 first-time buyers completed purchases in 2025 — an 18% increase on 2024.
- First-time buyers accounted for 54% of all mortgage-backed property purchases in 2025.
- In January 2026, FTBs represented 34.3% of all homes sold across Great Britain — the highest share for that month since records began in 2006.
- Housing affordability improved in 70% of UK local authority areas over the past year.
- The FTB stamp duty nil-rate threshold is £300,000 (since April 2025, down from £425,000).
- The permanent Mortgage Guarantee Scheme supports 95% LTV mortgages on homes up to £600,000.
- Help to Buy Equity Loan remains closed — no replacement announced.
- The Lifetime ISA provides a 25% government bonus on savings toward a first home.
- Approximately 6% of first-time buyers are under 25, down from 23% in the 1990s.
- Over 50% of FTB households now rely on dual incomes to qualify for a mortgage.
Source: Shaded Canvas analysis of ONS, UK Finance, Bank of England, HM Land Registry, Nationwide, and Halifax data. Last updated April 2026. Cite as: "First-Time Buyer Statistics UK 2026, Shaded Canvas (blog.shadedcanvas.co.uk)."
Average First-Time Buyer Age
The average age of a UK first-time buyer in 2026 is 33.9 years. In London, that figure rises to approximately 34.5 years.
This represents an increase of nearly 1.5 years over the past decade. The shift reflects three structural forces: rising deposit requirements that demand longer saving periods, the expansion of higher education delaying career earnings, and increased reliance on dual-income households to meet affordability thresholds.
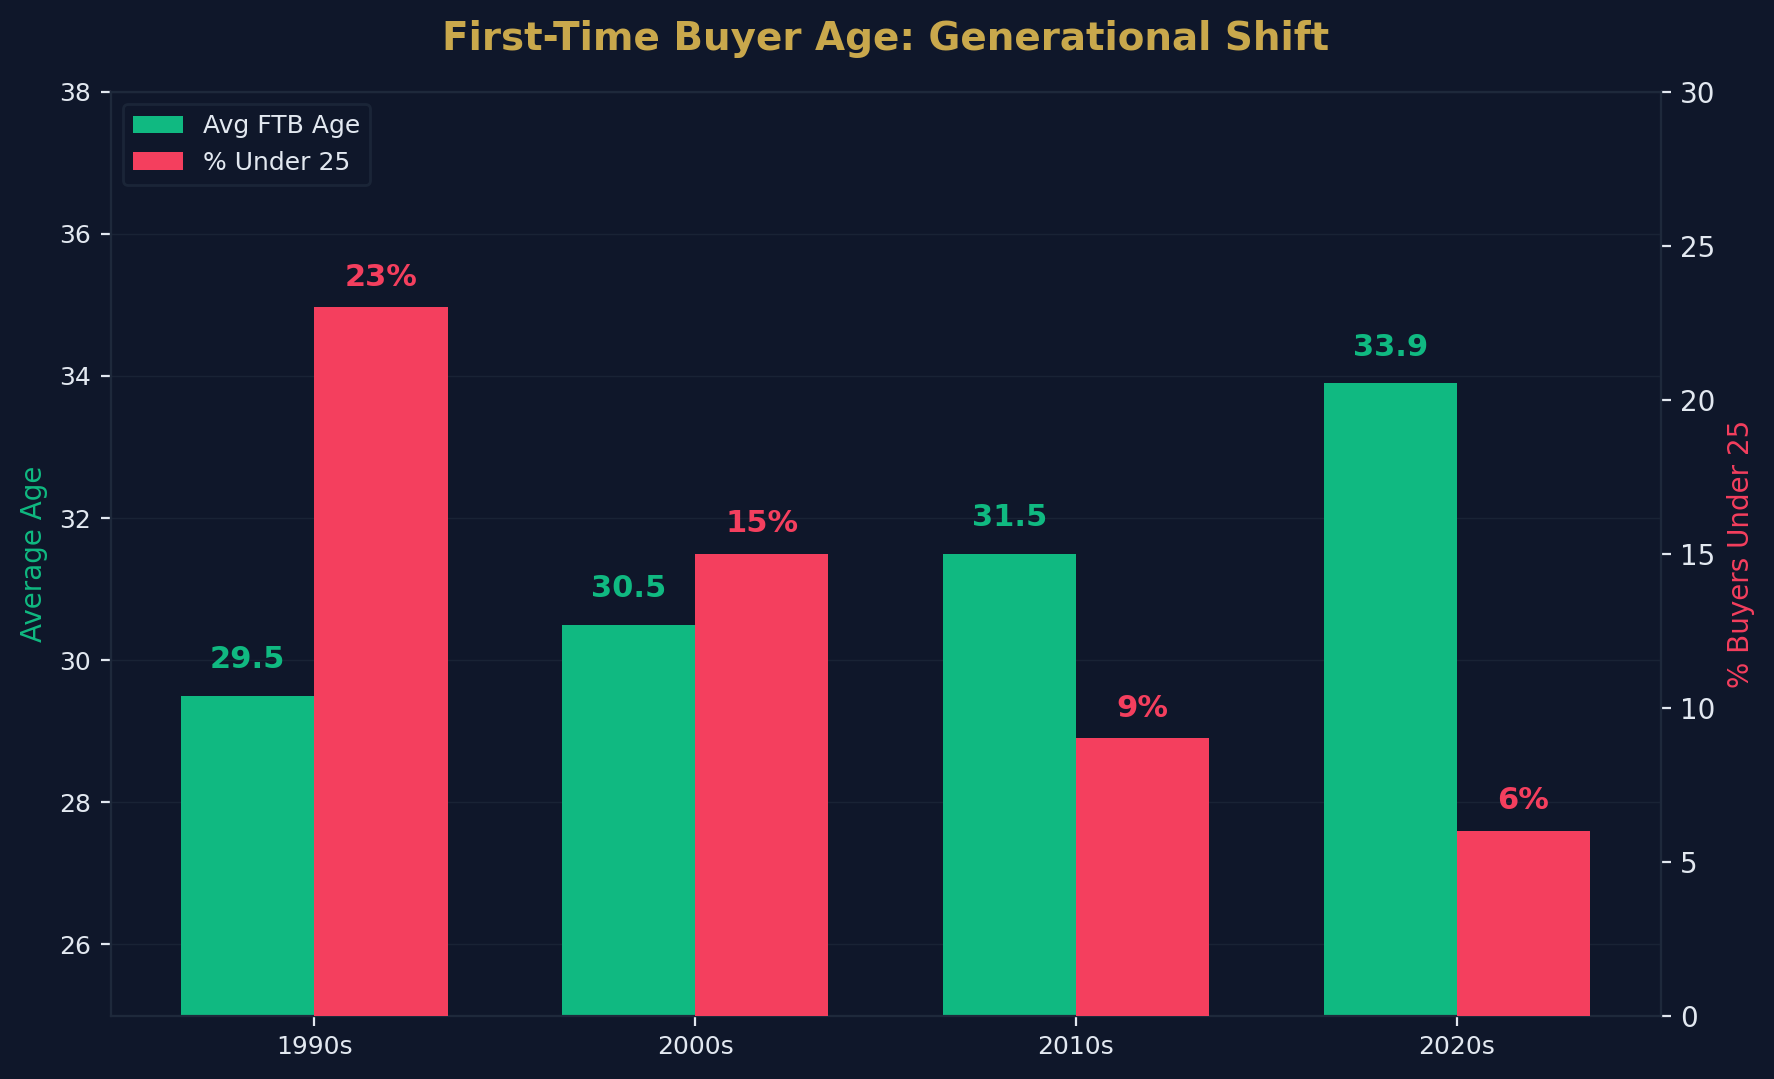
Generational Shift in FTB Age
| Decade | Approximate Average FTB Age | FTBs Under 25 |
|---|---|---|
| 1990s | 29–30 | 23% |
| 2000s | 30–31 | 15% |
| 2010s | 31–32 | 9% |
| 2020s | 33–34 | 6% |
The collapse in under-25 buyers — from nearly a quarter in the 1990s to just 6% today — is the starkest indicator of how the property market has structurally excluded younger entrants. A 22-year-old earning the median salary of £34,000 would need approximately 8–10 years to save a 10% deposit for the average UK property, assuming no parental help and a savings rate of 15% of gross income.
Average House Price for First-Time Buyers
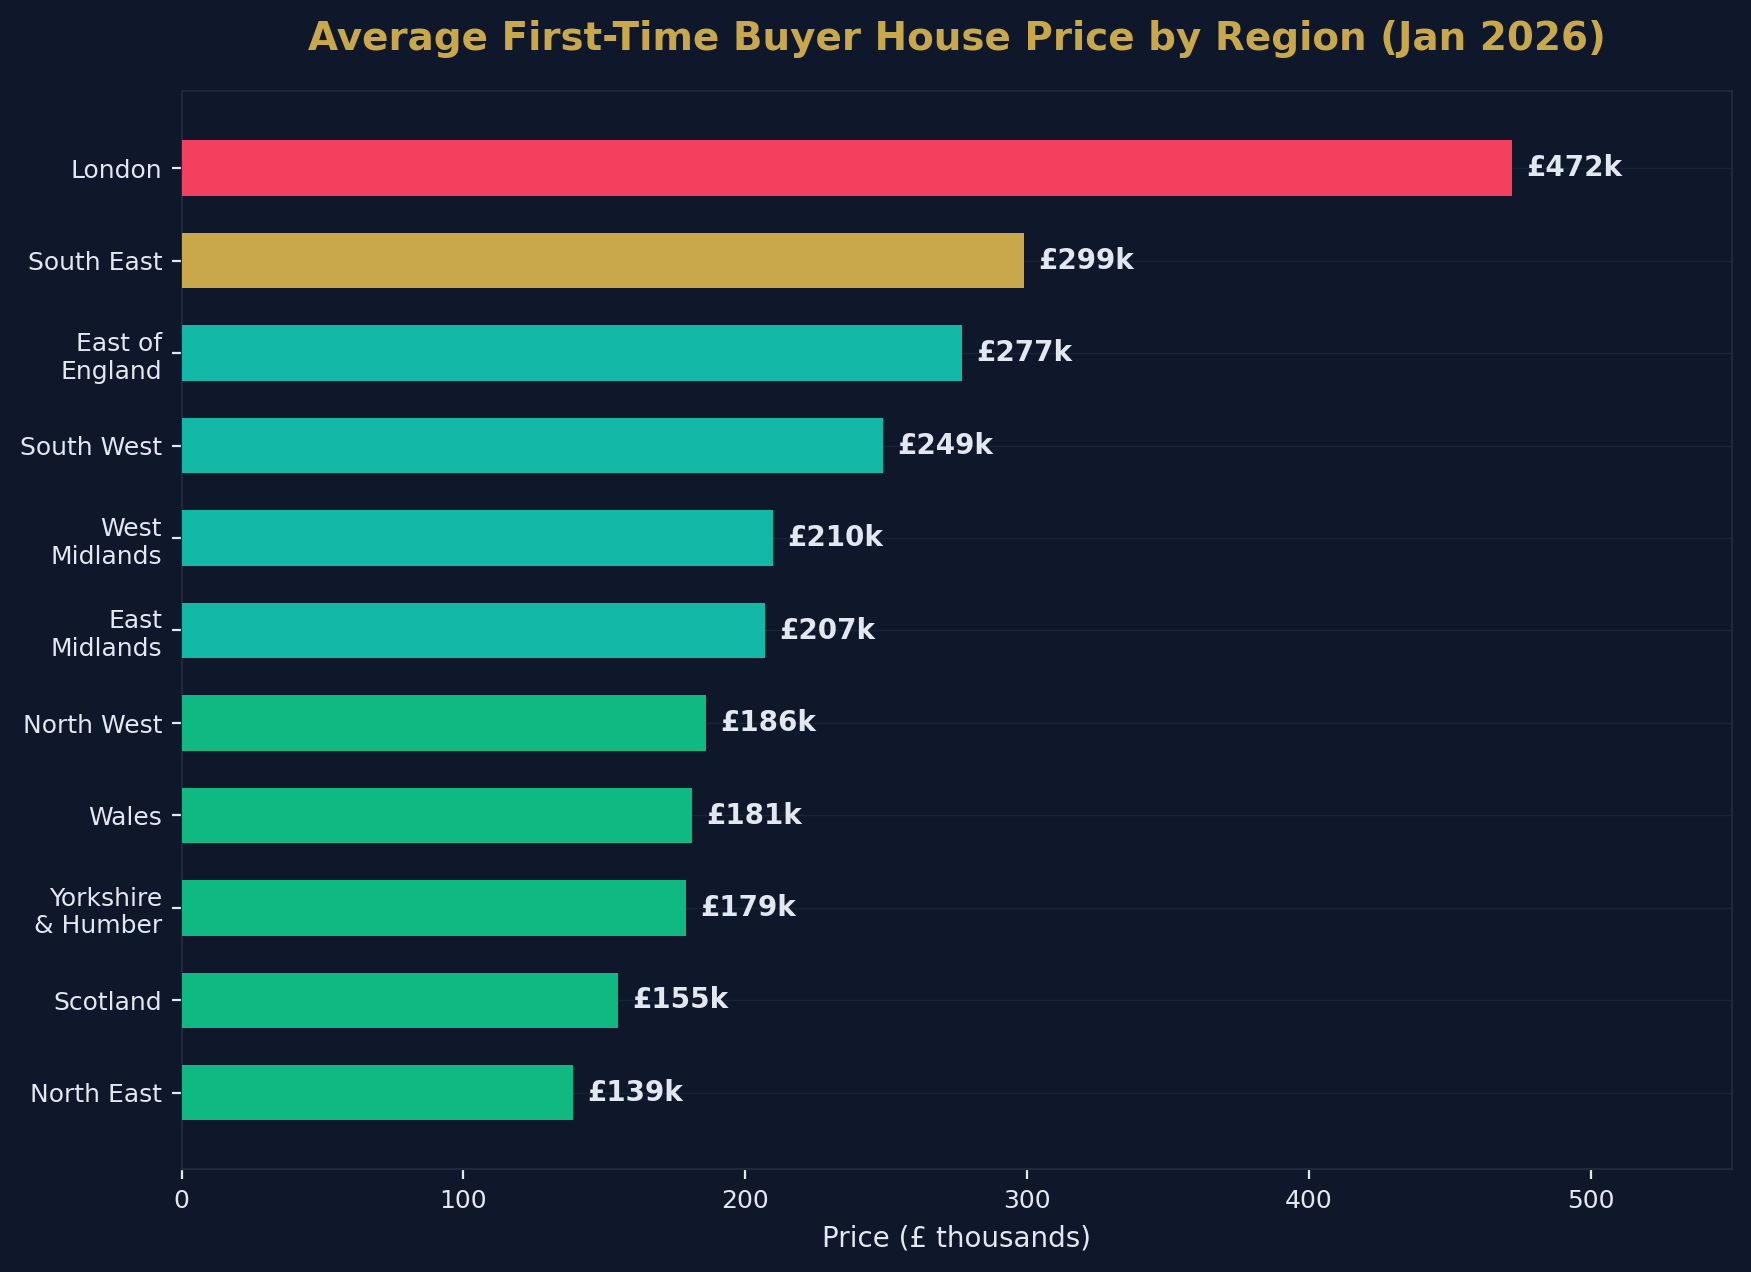
The average house price paid by a first-time buyer in January 2026 was £226,000 nationally. However, this figure conceals enormous regional variation — a first-time buyer in the North East pays less than a third of what their London counterpart faces.
FTB Average House Price by Region (January 2026)
| Region | Average FTB Price |
|---|---|
| London | £472,000 |
| South East | £299,000 |
| East of England | £277,000 |
| South West | £249,000 |
| West Midlands | £210,000 |
| East Midlands | £207,000 |
| North West | £186,000 |
| Wales | £181,000 |
| Yorkshire and the Humber | £179,000 |
| <a href="/post/invest-in-scotland-property" style="color:#c9a84c;text-decoration:underline;font-weight:500">Scotland | £155,000 |
| North East | £139,000 |
The London premium is staggering: at £472,000, the average London FTB property costs 3.4 times the North East average (£139,000). This single data point explains why London's homeownership rate among under-35s has fallen below 30%, while rates in northern regions remain above 50%.
Most and Least Affordable Areas
Most Affordable Local Authorities (2026):
- Inverclyde (Scotland) — average FTB price ~£100,000
- Burnley (North West) — average FTB price ~£95,000
- Hartlepool (North East) — average FTB price ~£105,000
- Blaenau Gwent (Wales) — average FTB price ~£110,000
- County Durham (North East) — average FTB price ~£115,000
Least Affordable Local Authorities (2026):
- Kensington and Chelsea (London) — average FTB price ~£1.2 million
- Westminster (London) — average FTB price ~£950,000
- Camden (London) — average FTB price ~£780,000
- Oxford (South East) — average FTB price ~£450,000
- Cambridge (East of England) — average FTB price ~£420,000
The Deposit Barrier
The deposit is the single biggest obstacle to homeownership in the UK. It is no longer interest rates or monthly mortgage payments that lock people out — it is the upfront capital required to enter the market.
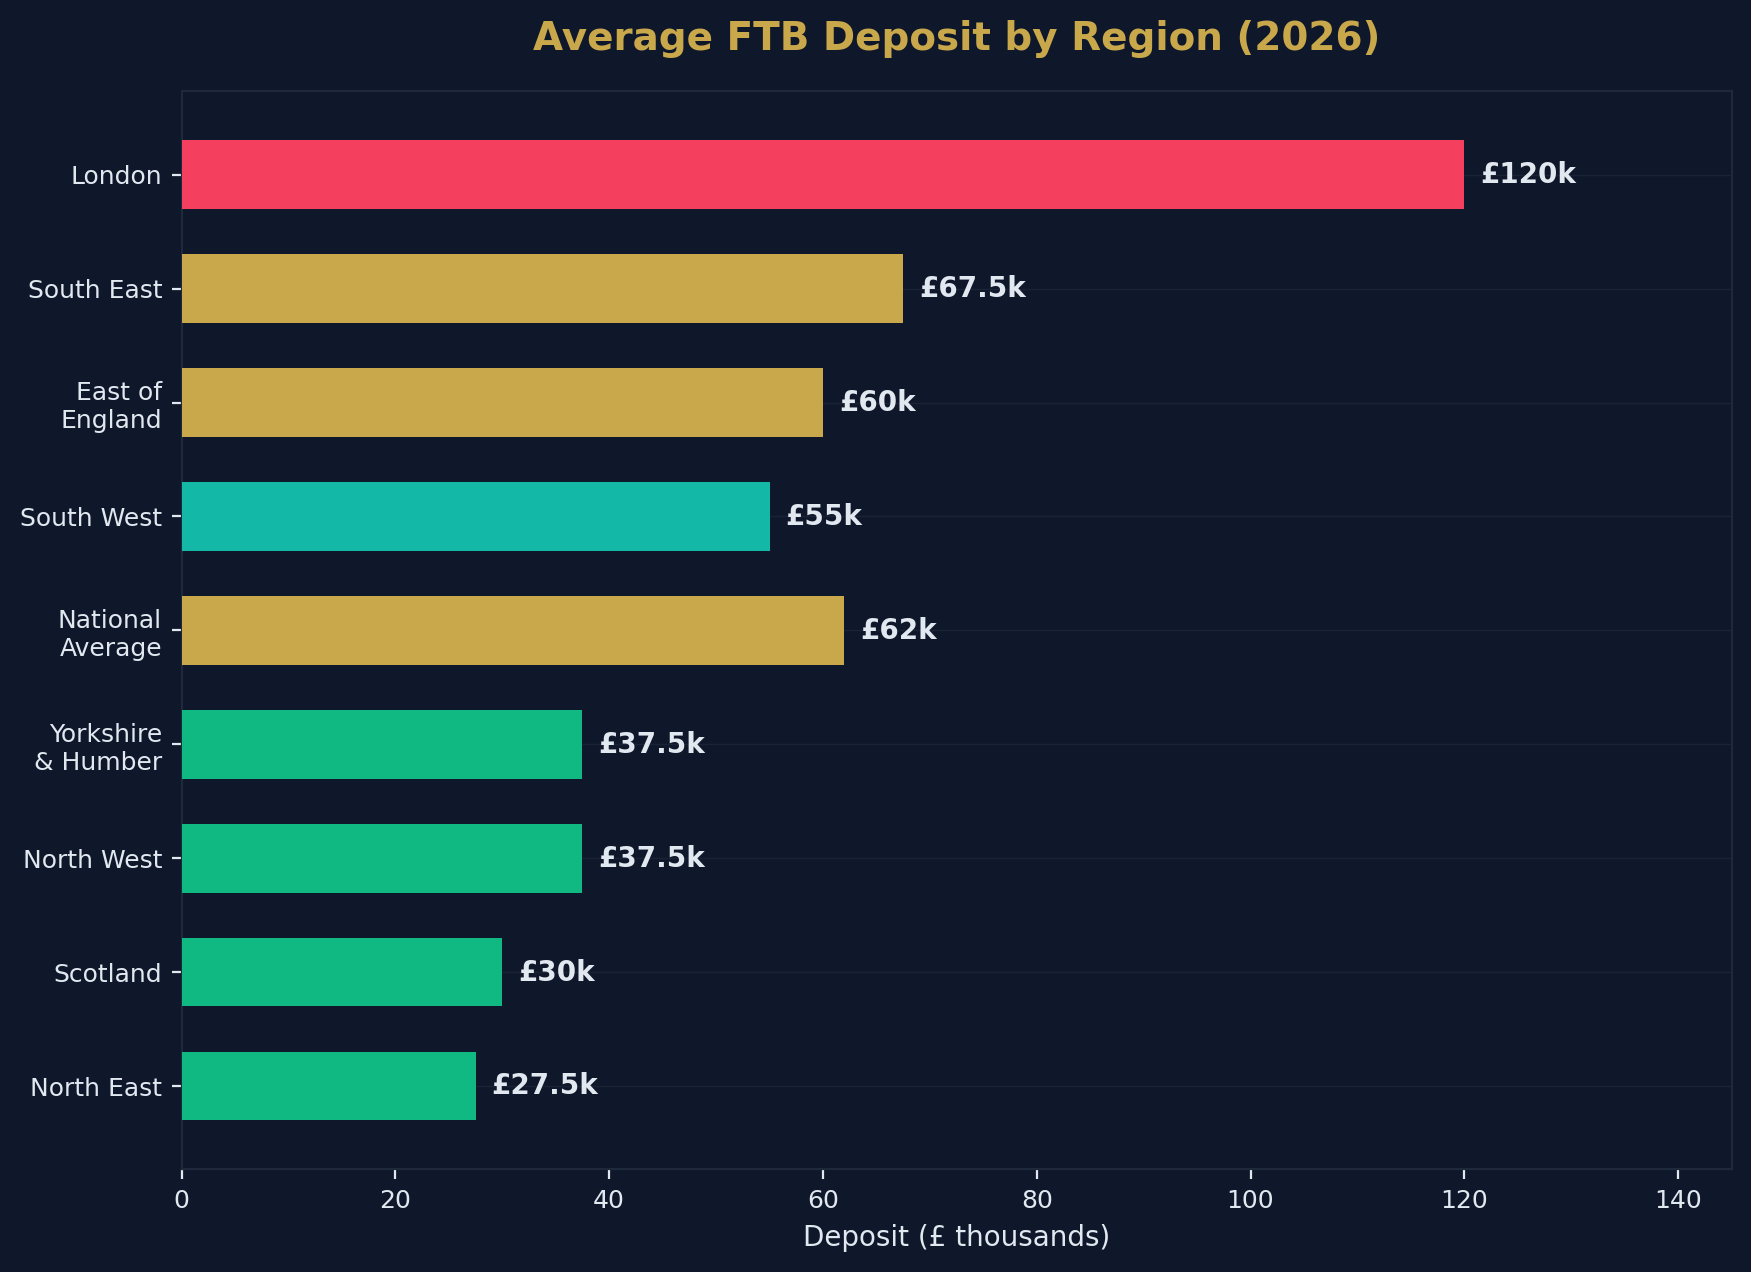
Average FTB Deposit by Region
| Region | Estimated Average Deposit | % of Purchase Price |
|---|---|---|
| London | £120,000+ | ~25% |
| South East | £60,000–£75,000 | ~22% |
| East of England | £55,000–£65,000 | ~21% |
| South West | £50,000–£60,000 | ~22% |
| National Average | £60,000–£64,000 | ~20–25% |
| North West | £35,000–£40,000 | ~20% |
| Yorkshire & Humber | £35,000–£40,000 | ~20% |
| North East | £25,000–£30,000 | ~20% |
| Scotland | £25,000–£35,000 | ~18% |
The "Bank of Mum and Dad"
Family financial support has become a structural feature of the UK housing market, not an exception. Industry data consistently shows that a significant proportion of first-time buyers receive gifted deposits or loans from parents and family members.
Key findings:
- An estimated 30–40% of first-time buyers receive some form of financial assistance from family
- The average gifted deposit contribution is approximately £25,000–£30,000
- Family-assisted buyers enter the market on average 3–5 years earlier than those saving independently
- The "Bank of Mum and Dad" is effectively the UK's 9th largest mortgage lender by value of deposits facilitated
This dynamic creates a two-tier market: those with access to family wealth and those without. For buyers without parental support, the average time to save a 10% deposit on a national-average FTB property exceeds 10 years at the median savings rate.
Deposit Savings Timeline
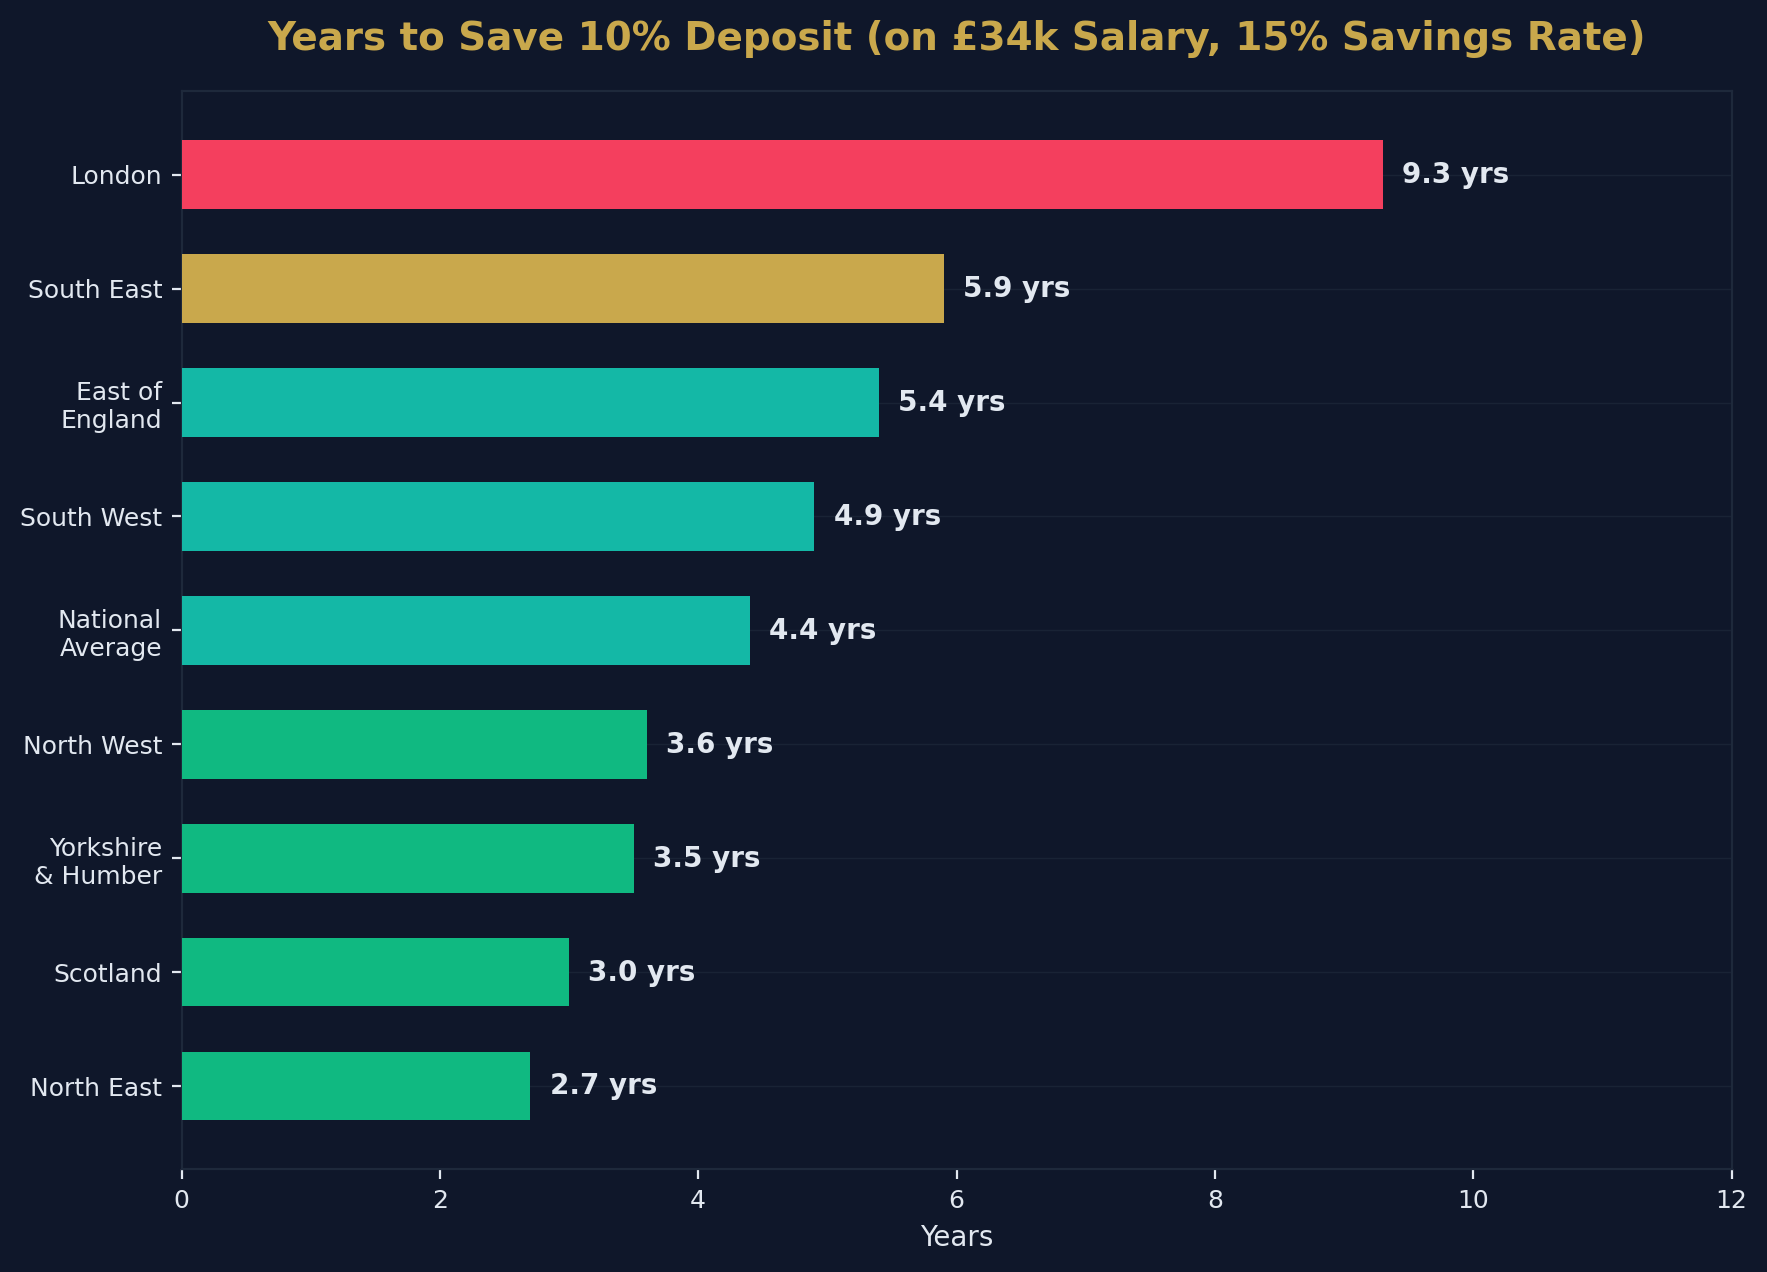
How long does it take to save a deposit with no help? Assuming a gross salary of £34,000 and a savings rate of 15%:
| Region | 10% Deposit Required | Years to Save |
|---|---|---|
| North East | £13,900 | 2.7 years |
| Scotland | £15,500 | 3.0 years |
| Yorkshire & Humber | £17,900 | 3.5 years |
| North West | £18,600 | 3.6 years |
| National Average | £22,600 | 4.4 years |
| South West | £24,900 | 4.9 years |
| East of England | £27,700 | 5.4 years |
| South East | £29,900 | 5.9 years |
| London | £47,200 | 9.3 years |
These figures assume zero rental costs eating into savings capacity — in practice, a London renter paying £1,400/month in rent would take 15+ years to accumulate a 10% deposit while also covering living expenses.
House Price-to-Earnings Ratio
The house price-to-earnings ratio (HPER) is the most widely used measure of housing affordability. It compares the average FTB house price to the average annual earnings of a buyer.
National Trend
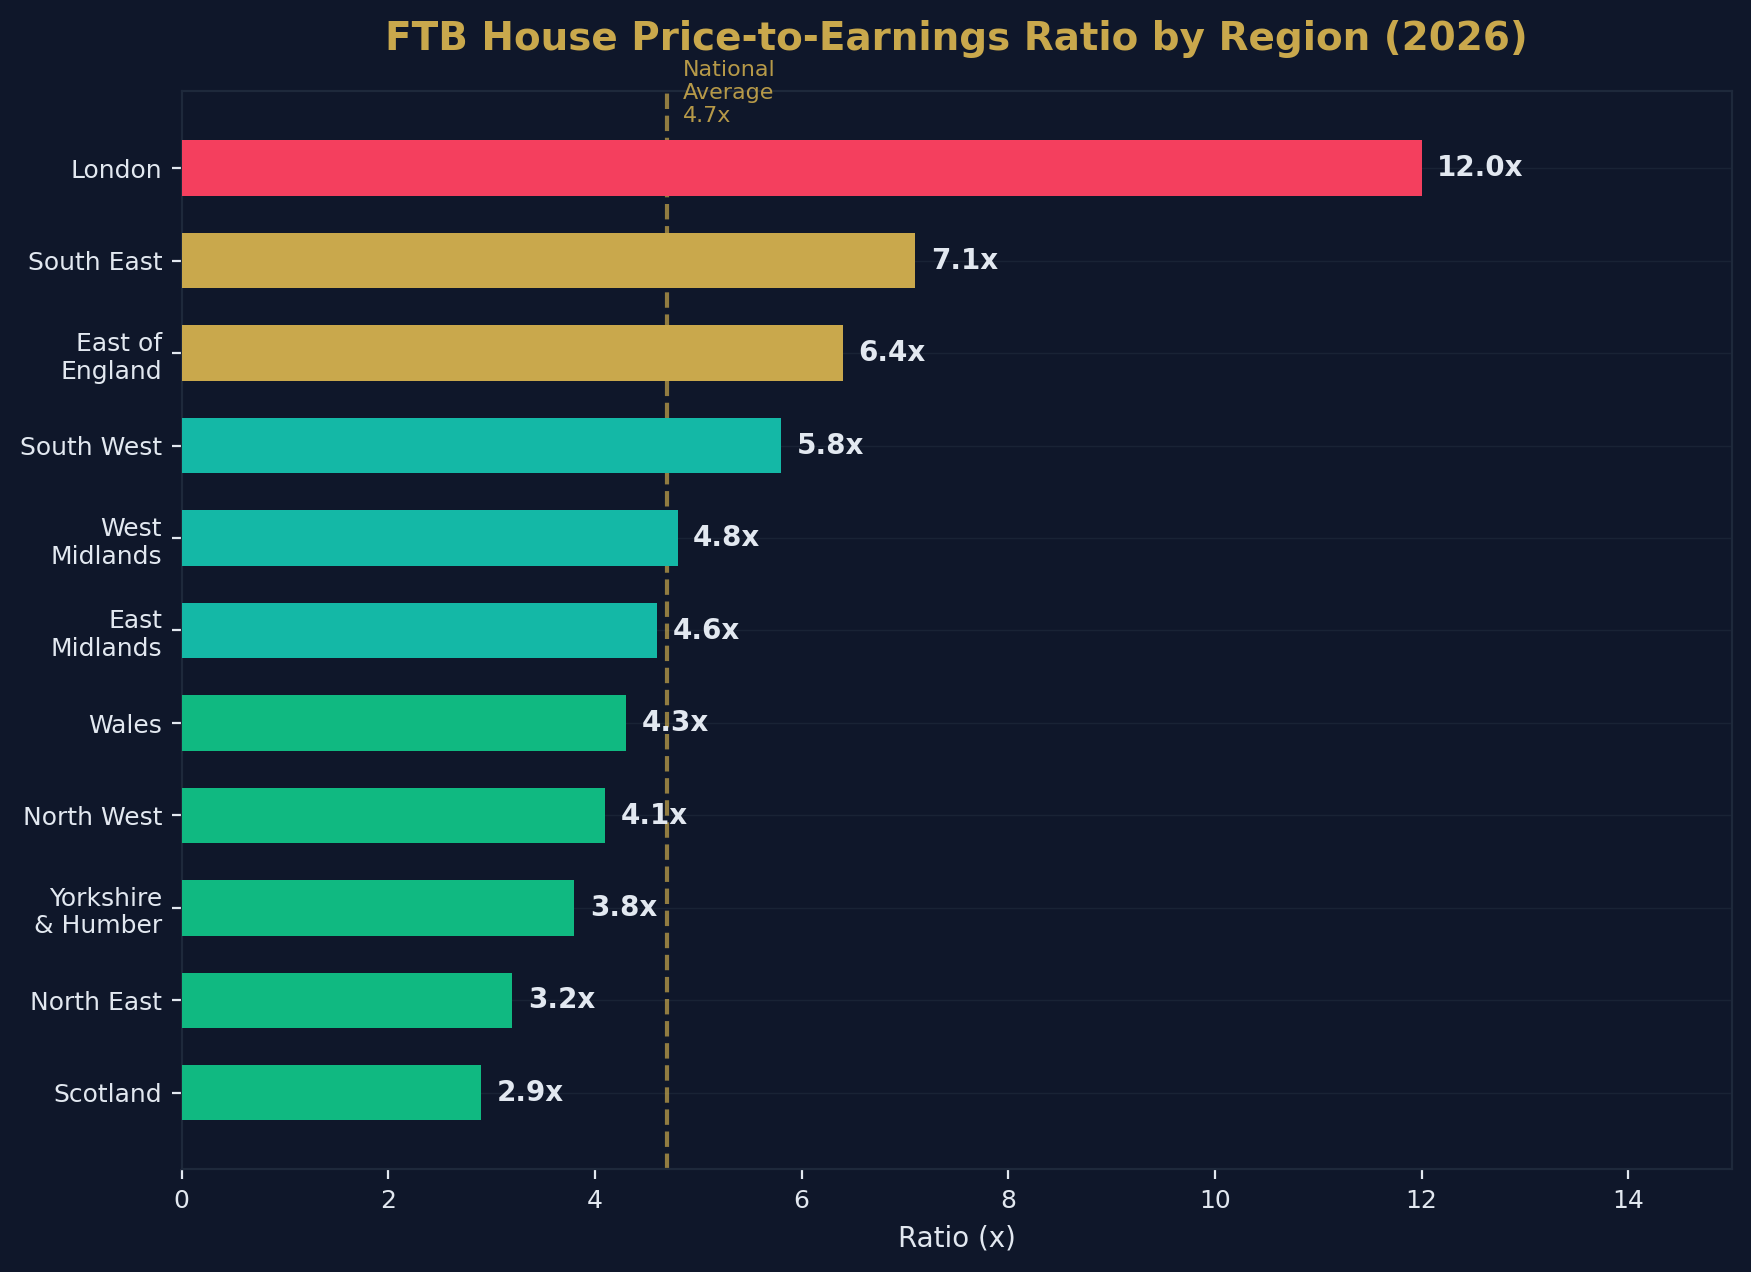
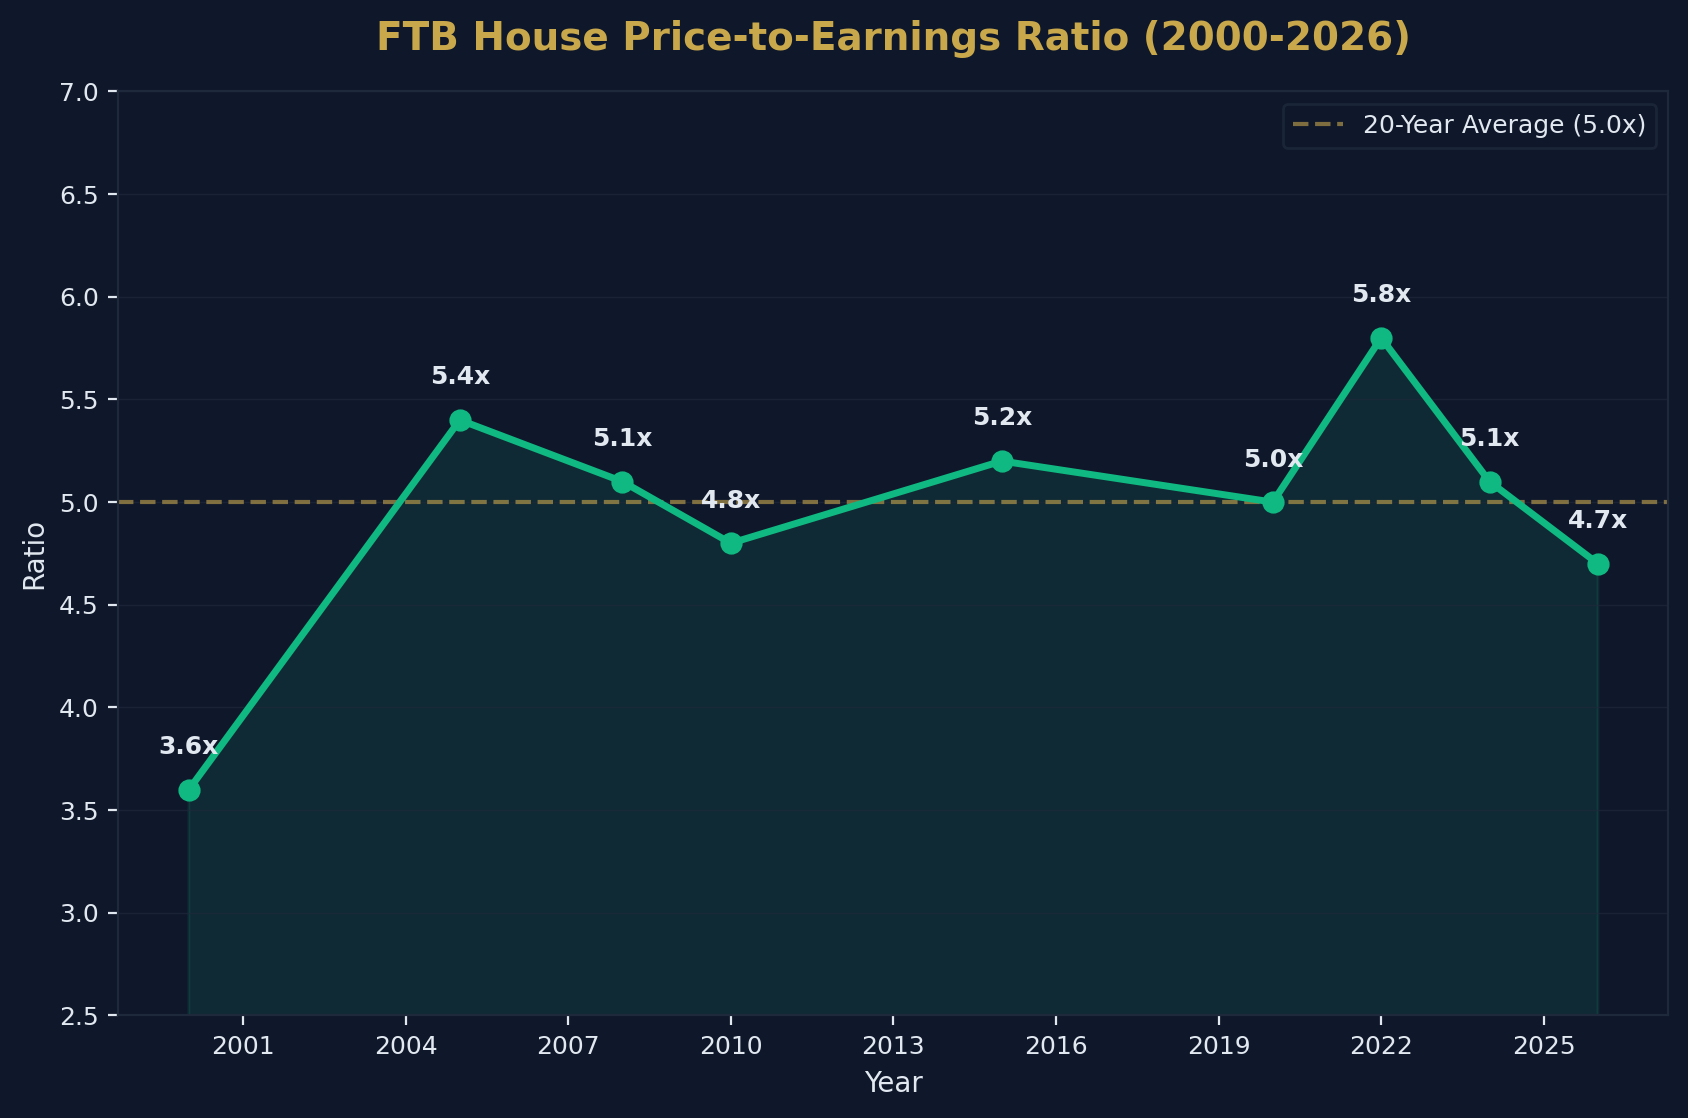
The national FTB HPER in early 2026 is 4.7x — meaning the average first-time buyer pays 4.7 times their annual gross income for their first home. This is below the 20-year average (approximately 5.0x) for the first time since 2020.
HPER by Region
| Region | Approximate HPER | Affordability |
|---|---|---|
| Scotland | 2.9x | Most affordable |
| North East | 3.2x | Very affordable |
| Yorkshire & Humber | 3.8x | Affordable |
| North West | 4.1x | Affordable |
| Wales | 4.3x | Below average |
| East Midlands | 4.6x | Average |
| West Midlands | 4.8x | Average |
| South West | 5.8x | Stretched |
| East of England | 6.4x | Stretched |
| South East | 7.1x | Unaffordable |
| London | 12.0x+ | Severely unaffordable |
Scotland's HPER of 2.9x means the average Scottish first-time buyer pays less than three years' salary for their home. In London, the equivalent figure exceeds 12x — a ratio that is functionally impossible to service without either significant parental support, dual high incomes, or inheritance.
Historical Affordability Trend
| Year | National FTB HPER | Direction |
|---|---|---|
| 2000 | 3.6x | — |
| 2005 | 5.4x | ▲ |
| 2008 | 5.1x | → |
| 2010 | 4.8x | ▼ |
| 2015 | 5.2x | ▲ |
| 2020 | 5.0x | → |
| 2022 | 5.8x | ▲ Peak |
| 2024 | 5.1x | ▼ |
| 2026 | 4.7x | ▼ Best since 2020 |
The improvement from 5.8x in 2022 to 4.7x in 2026 has been driven almost entirely by wage growth outpacing house prices, rather than any decline in property values. Average earnings grew by approximately 5–6% annually during 2023–2025, while house prices rose by just 1–2%.
Stamp Duty for First-Time Buyers
Since 1 April 2025, the stamp duty regime for first-time buyers in England and Northern Ireland has been as follows:
Current FTB SDLT Rates (from April 2025)
| Purchase Price Band | SDLT Rate |
|---|---|
| Up to £300,000 | 0% |
| £300,001 – £500,000 | 5% (on the amount above £300,000) |
| Over £500,000 | Standard residential rates apply (no FTB relief) |
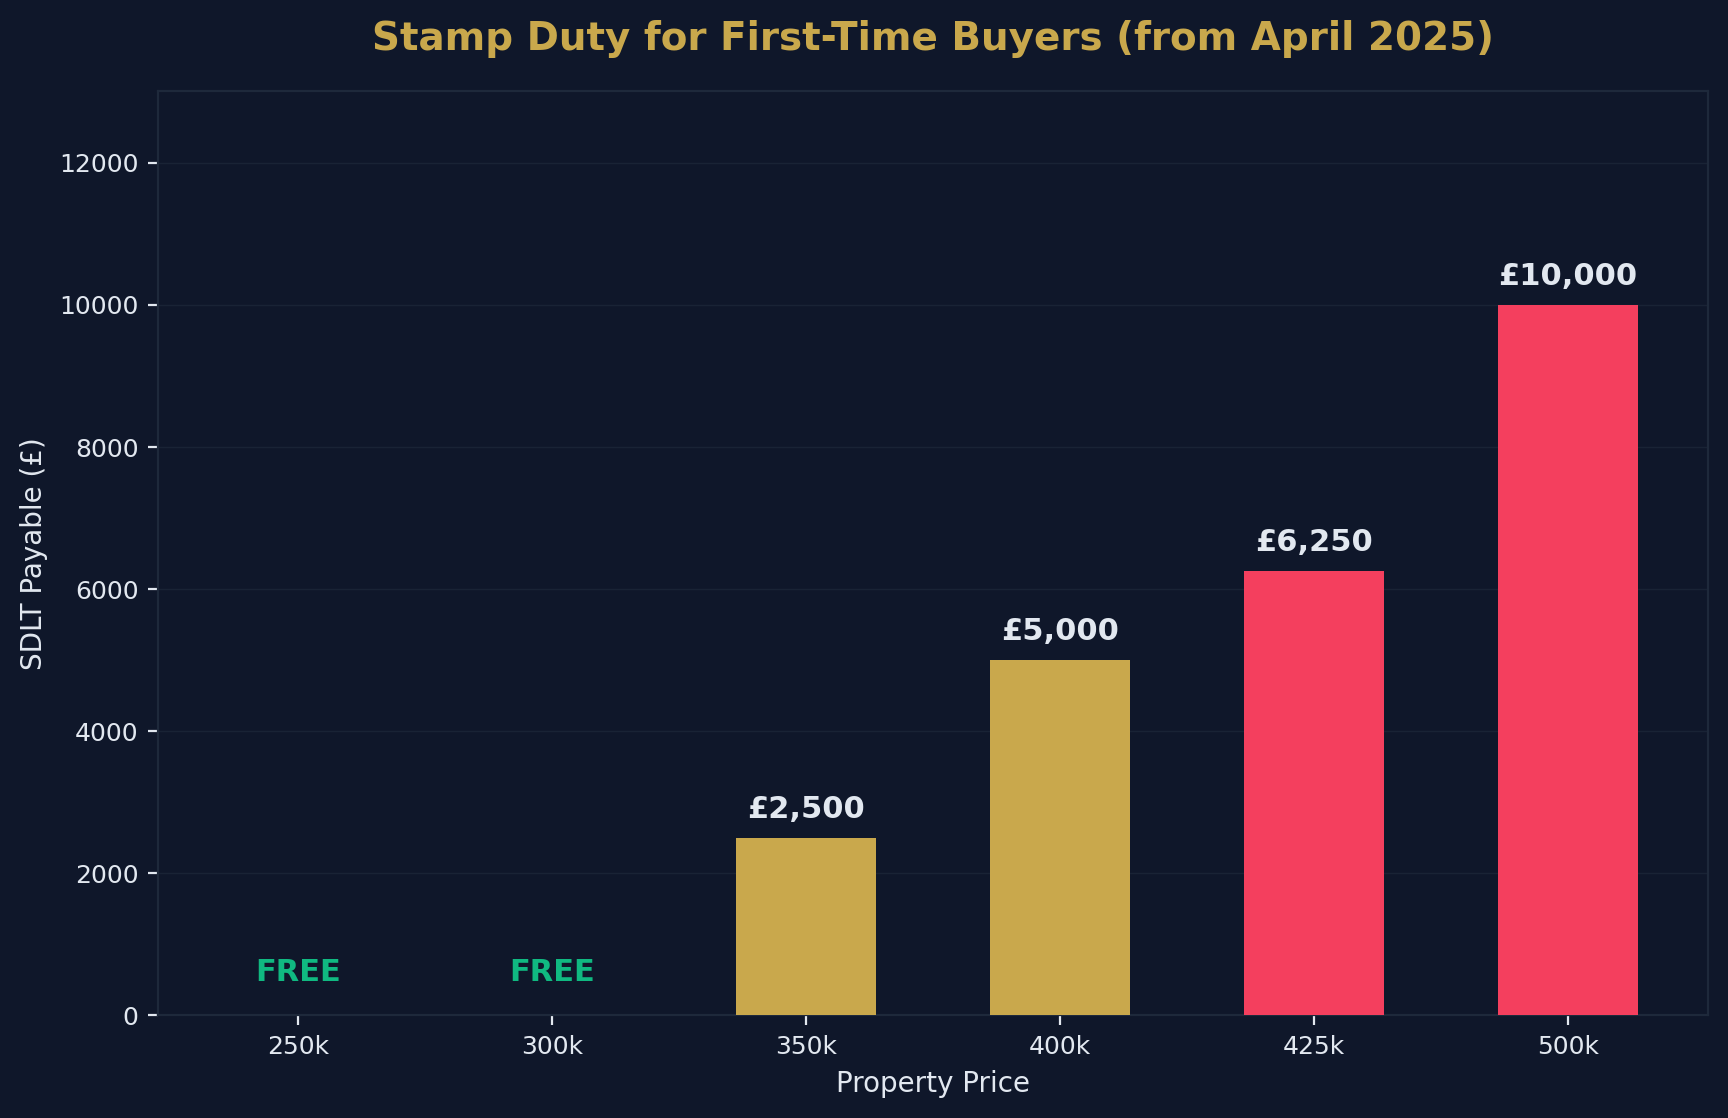
SDLT Examples
| Property Price | SDLT Payable |
|---|---|
| £250,000 | £0 |
| £300,000 | £0 |
| £350,000 | £2,500 |
| £400,000 | £5,000 |
| £425,000 | £6,250 |
| £500,000 | £10,000 |
What Changed in April 2025
The temporary higher threshold of £425,000 ended on 31 March 2025, reverting to £300,000. This change increased the SDLT bill for a first-time buyer purchasing at the former threshold (£425,000) from £0 to £6,250 — a meaningful additional cost at a point in the transaction when cash reserves are already stretched.
For FTBs in London and the South East, where the average FTB property exceeds £300,000, this threshold reduction has added between £2,500 and £10,000 to their purchase costs.
Scotland and Wales operate separate property transaction tax systems with different thresholds and rates.
First-Time Buyer Mortgage Market
Mortgage Approvals
Bank of England data shows net mortgage approvals for house purchases reached 62,600 in February 2026, up from 60,200 in January. First-time buyers account for the majority of these approvals.
FTB Mortgage Products
| Product Type | Availability | Key Features |
|---|---|---|
| 95% LTV Mortgages | Widely available | Mortgage Guarantee Scheme (permanent from July 2025), max property value £600,000 |
| 90% LTV Mortgages | Standard | Most competitive rates available at this LTV |
| Shared Ownership | Active | Buy 25–75% share, pay rent on remainder |
| First Homes Scheme | Limited | 30–50% discount on new-builds for eligible FTBs |
| Lifetime ISA | Active | 25% government bonus on savings up to £4,000/year |
Help to Buy Status
The Help to Buy Equity Loan scheme remains closed. It stopped accepting new applications in October 2022 and completed final transactions in March 2023. As of April 2026, the government has confirmed there are no plans to reintroduce a replacement equity loan scheme.
Lending Trends
Key trends in FTB mortgage lending:
- Longer terms: 35-year and even 40-year mortgage terms are now offered as standard by many lenders to reduce monthly payments
- Higher multiples: Some lenders offer income multiples above 4.5x for borrowers meeting specific criteria
- Joint Borrower Sole Proprietor (JBSP): Products allowing parents to be on the mortgage but not the title deed are increasingly popular
- Dual income reliance: Over 50% of FTB households now require two incomes to qualify
First-Time Buyer Volume and Market Share
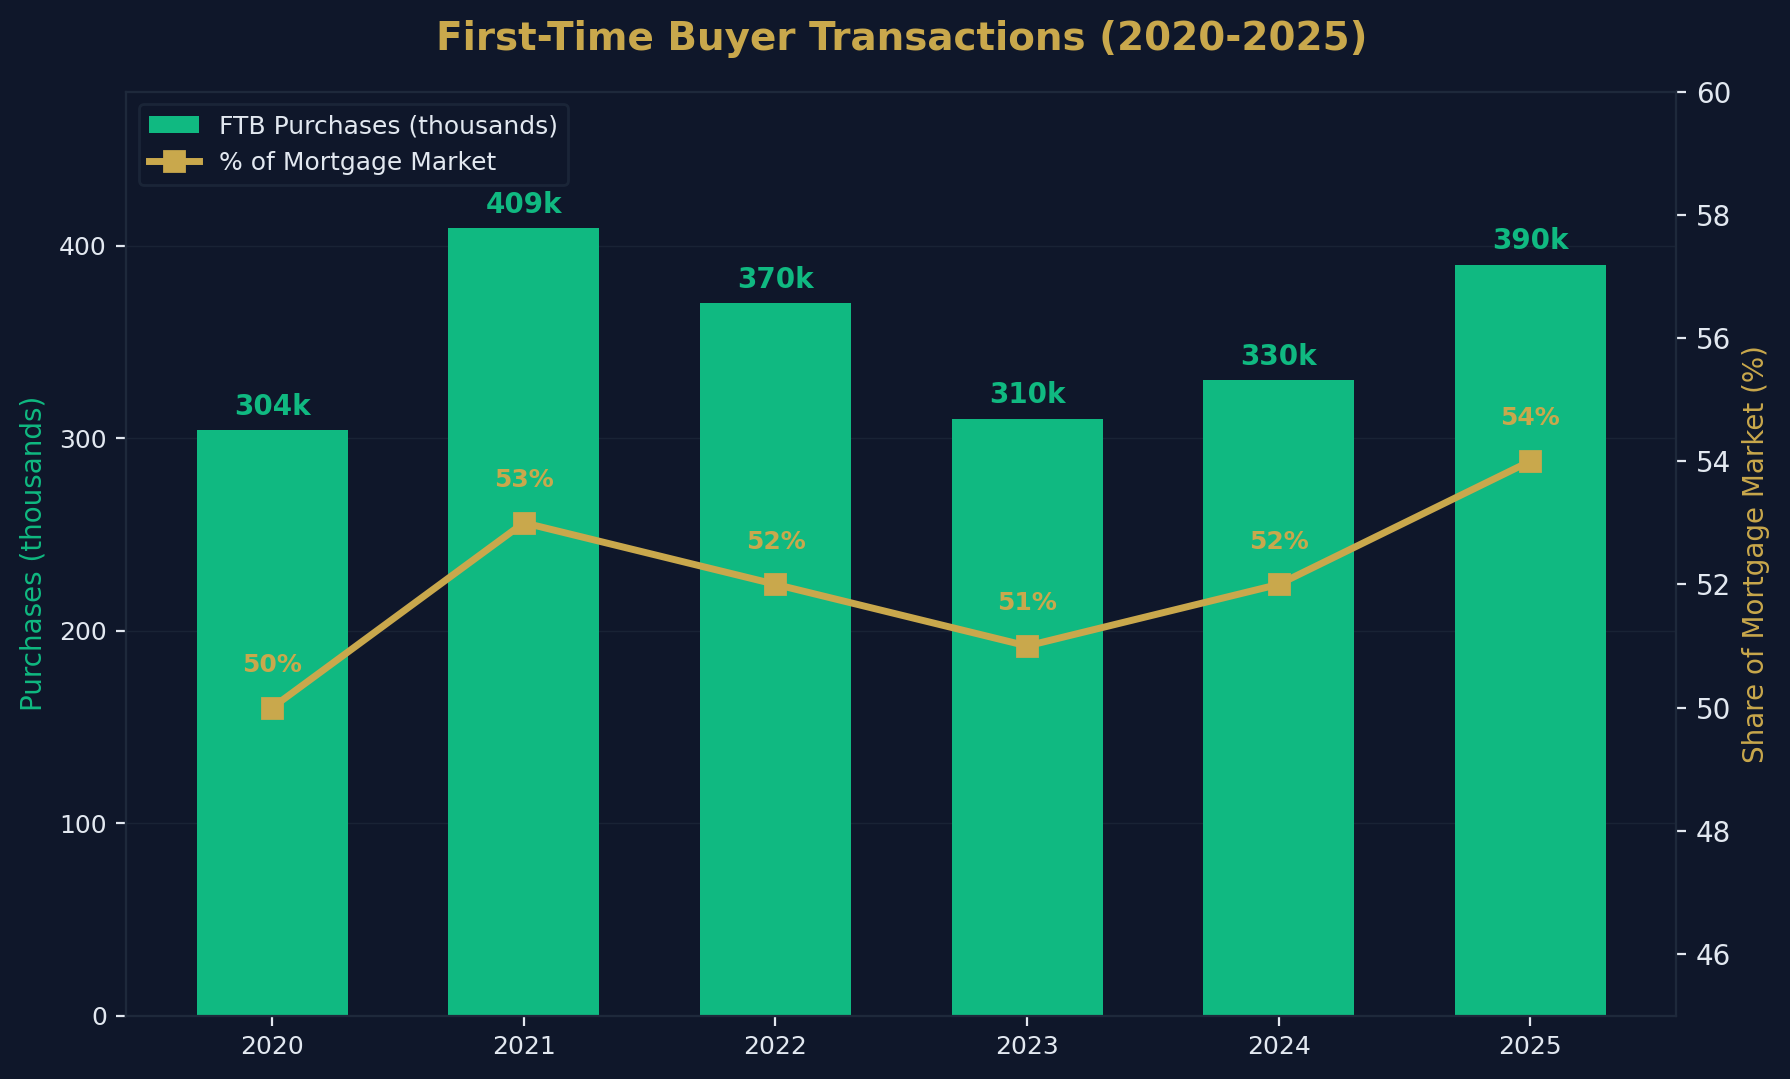
Annual FTB Transactions
| Year | Estimated FTB Purchases | Share of Mortgage Market | YoY Change |
|---|---|---|---|
| 2020 | 304,000 | 50% | -12% |
| 2021 | 409,000 | 53% | +35% |
| 2022 | 370,000 | 52% | -10% |
| 2023 | 310,000 | 51% | -16% |
| 2024 | 330,000 | 52% | +6% |
| 2025 | 390,000 | 54% | +18% |
The 2025 surge (+18%) was significantly amplified by the SDLT deadline rush: first-time buyers accelerated purchases in Q1 2025 to complete before the April threshold reduction. UK Finance reported a 62% year-on-year increase in FTB completions in Q1 2025 alone.
Despite the deadline distortion, the underlying trend shows first-time buyers consistently comprising the majority of the mortgage market — a reflection of both policy support (SDLT relief, 95% LTV availability) and the relative absence of investor competition in the sub-£300,000 segment.
Generational Comparison: Then vs Now
The "was it easier to buy in the 1990s?" debate is one of the most frequently cited topics in UK housing discourse. The data provides a definitive answer.
The Numbers
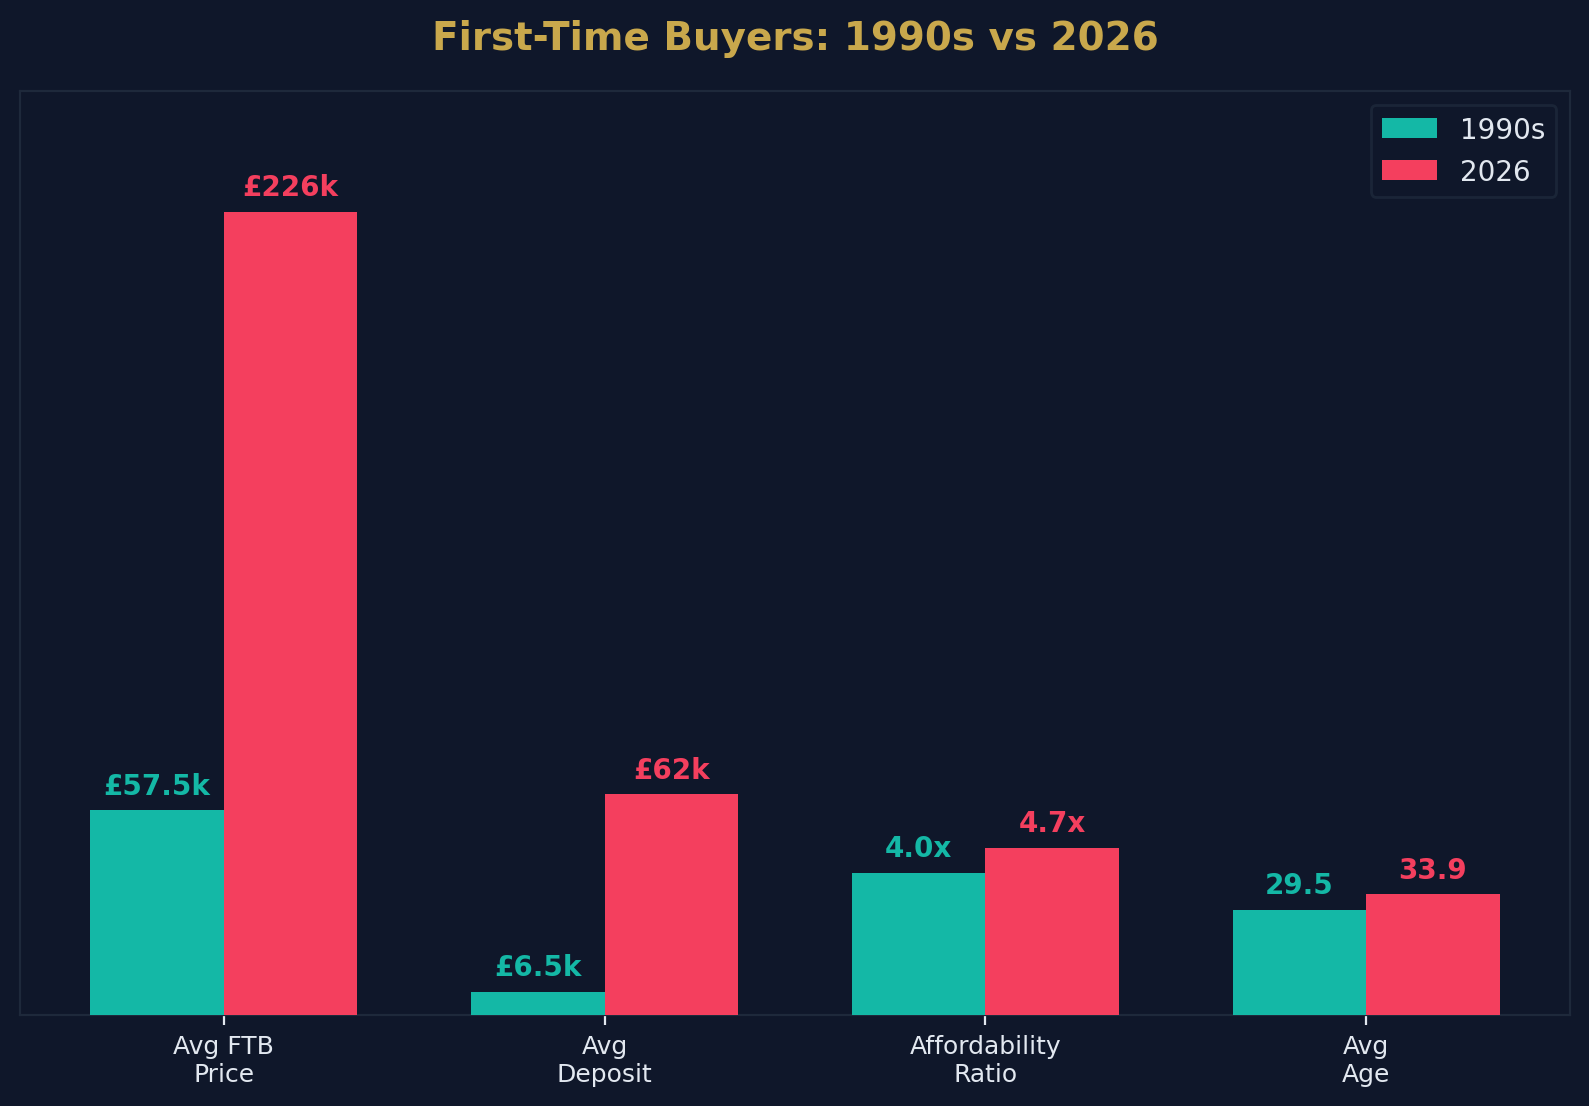
| Metric | 1990s | 2026 | Change |
|---|---|---|---|
| Average FTB age | 29–30 | 33.9 | +4–5 years |
| Average FTB price | £55,000–£60,000 | £226,000 | +277% |
| Average deposit | £5,000–£8,000 | £60,000–£64,000 | +700%+ |
| Affordability ratio | ~4x income | 4.7x income | +18% |
| Mortgage interest rate | 8–15% | 4–5% | -60% |
| FTBs under 25 | 23% | 6% | -74% |
| Dual income required | ~40% | 50%+ | +25% |
The Nuance
The raw affordability ratio (4x in the 1990s vs 4.7x in 2026) suggests that today's market is only marginally less affordable in terms of borrowing capacity. However, this comparison is misleading because:
The deposit barrier didn't exist in the 1990s in the same way. A 10% deposit on a £55,000 house was £5,500 — achievable within 1–2 years of saving. Today's equivalent (£22,600) takes 4–5 years.
Interest rates were higher, but so was inflation. High mortgage rates in the 1990s were painful in the short term but were accompanied by wage inflation that rapidly eroded the real value of debt. Today's lower rates come with near-zero wage inflation, meaning debt remains a larger proportion of income for longer.
Renting costs now consume deposit-saving capacity. In the 1990s, renting was significantly cheaper relative to income. Today, a renter paying £1,200/month has £14,400 fewer savings capacity per year — making it functionally impossible to save a deposit without either living with parents or receiving family help.
Government Schemes and Support
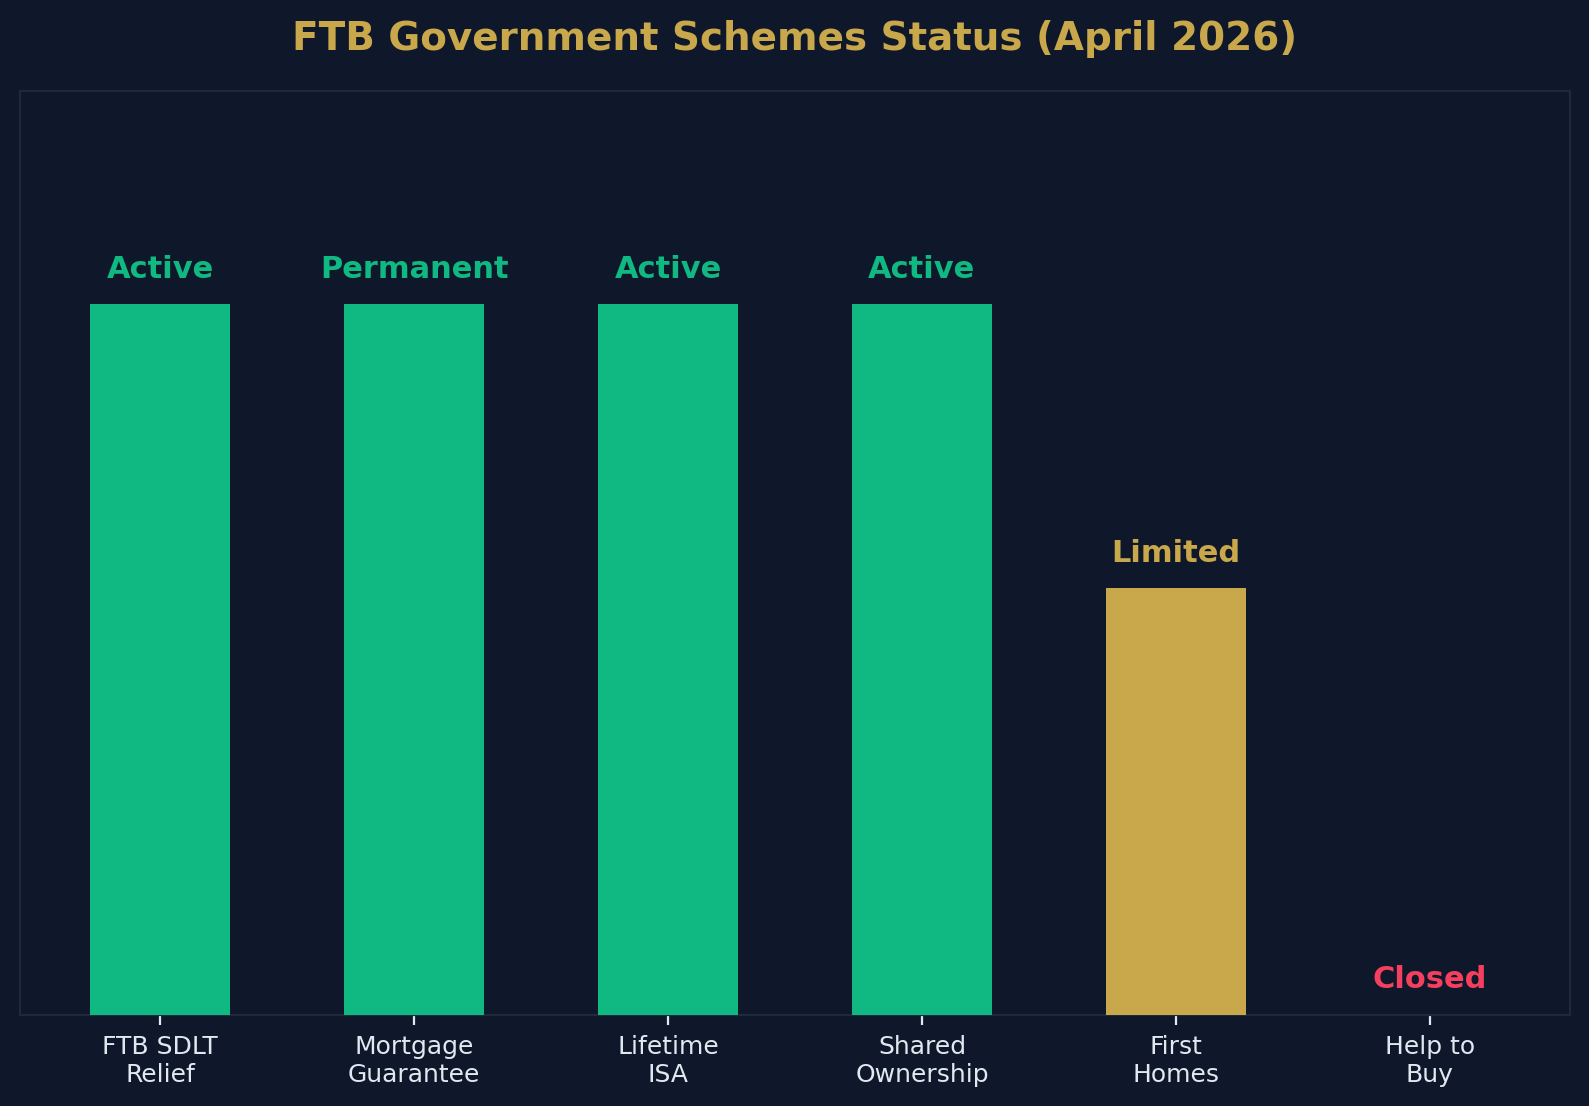
Currently Available Schemes (April 2026)
| Scheme | Status | Key Details |
|---|---|---|
| FTB Stamp Duty Relief | Active | 0% up to £300,000, 5% on £300k–£500k |
| Mortgage Guarantee Scheme | Permanent | 95% LTV, homes up to £600,000 |
| Lifetime ISA | Active | 25% bonus on up to £4,000/year, for homes up to £450,000 |
| Shared Ownership | Active | Buy 25–75% share of a property |
| First Homes | Active (limited) | 30–50% discount on eligible new-builds |
| Right to Buy | Active (council tenants) | Discounts up to £87,200 (£116,200 in London) |
Closed Schemes
| Scheme | Closed | Notes |
|---|---|---|
| Help to Buy Equity Loan | October 2022 (applications) | No replacement announced |
| Help to Buy ISA | November 2019 (new accounts) | Existing accounts still earning bonuses |
| Stamp Duty Holiday | September 2021 | Temporary COVID measure |
Methodology and Data Sources
All statistics cited in this article are sourced from official government publications, central bank releases, and established industry research:
| Source | Data Type | URL |
|---|---|---|
| ONS UK House Price Index | House prices, affordability ratios | ons.gov.uk |
| HM Land Registry | Transaction prices by buyer type | gov.uk/land-registry |
| UK Finance | Mortgage lending, FTB volumes | ukfinance.org.uk |
| Bank of England | Mortgage approvals, interest rates | bankofengland.co.uk |
| Halifax / Nationwide | FTB price indices, age data | halifax.co.uk / nationwide.co.uk |
| HMRC | SDLT revenue, transaction volumes | gov.uk/hmrc |
| English Housing Survey | Tenure, demographics | gov.uk |
| GOV.UK | Scheme eligibility, policy updates | gov.uk |
How to Cite This Page
If you are referencing these statistics in your own content:
First-Time Buyer Statistics UK 2026. Shaded Canvas. Published April 2026, updated quarterly. Available at: https://blog.shadedcanvas.co.uk/post/first-time-buyer-statistics-uk-2026
Stop being a landlord. Start being an investor.
Shaded Canvas introduces serious capital to vetted UK property opportunities — targeting 12–16% net returns.
Start Investing →