The UK's chronic housing undersupply is the single most important structural force in the property market. Despite a government target of 300,000 net additions per year, England has consistently delivered 80,000–100,000 fewer homes than needed. This page consolidates every critical housing supply statistic for 2026, from NHBC registrations and housebuilder completions to planning permission data, affordable housing delivery, and the cumulative supply shortfall.
Whether you are an investor assessing long-term price support, a developer tracking market conditions, or a policymaker evaluating housing delivery, this is the definitive reference.
Last Updated: April 2026 | Next Update: July 2026
Key Housing Supply Statistics at a Glance
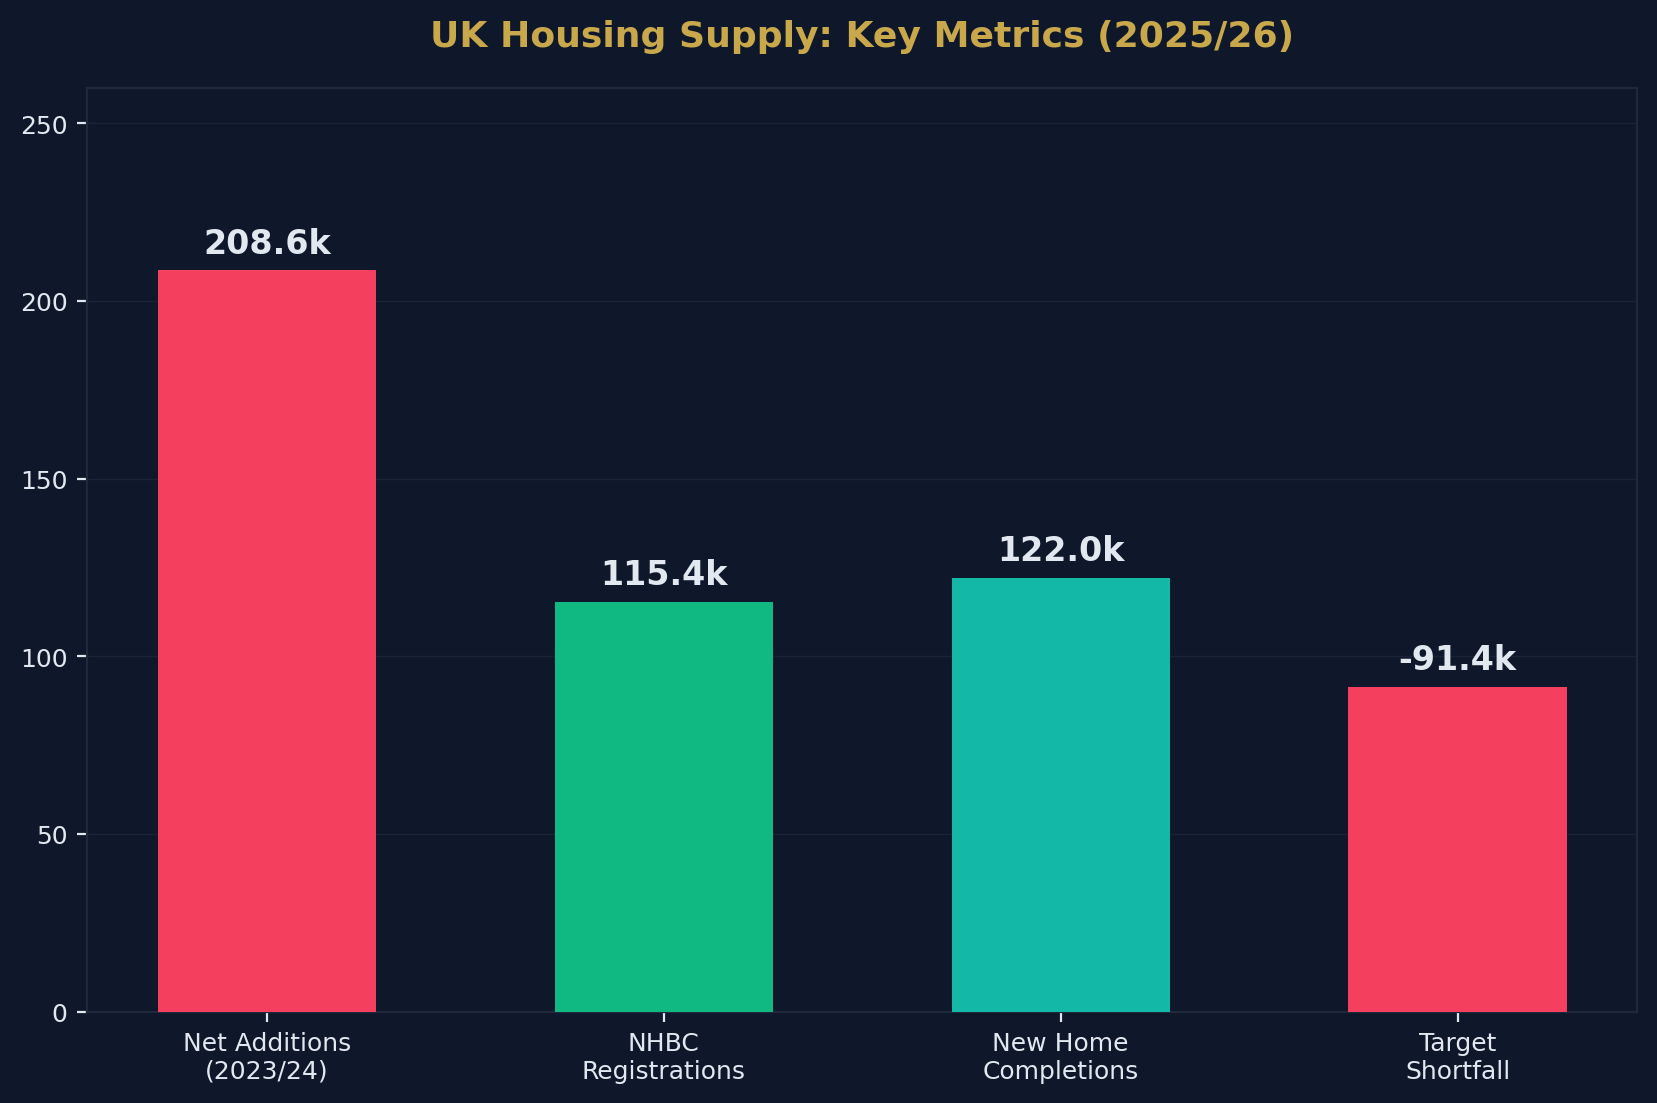
- NHBC registered 115,350 new homes in 2025 — up 11% year-on-year.
- New home completions in 2025: 122,012 — down 2% year-on-year.
- Net additions to housing stock (2023/24): 208,600 — a 31% shortfall vs the 300,000 target.
- The cumulative undersupply over the past decade is estimated at 800,000–1,000,000 homes.
- Six major volume housebuilders account for approximately 56% of all completions.
- London NHBC registrations fell 27% in 2025 due to Building Safety Regulator delays.
- Persimmon completed 11,905 homes in 2025 (+12% YoY), targeting 12,043 in 2026.
- Bellway completed 8,749 homes in 2025 (+14.3% YoY), targeting ~9,200 in 2026.
- Affordable housing delivery remains well below the ~90,000/year needed.
- The average time from planning application to completion exceeds 3 years.
- Planning applications granted have declined for four consecutive years.
- The government's mandatory housing targets were reinstated in late 2024.
- Build-to-Rent investment reached £5.3 billion in 2025.
- Analysts project a modest ~3% rise in sector completions for 2026.
Source: Shaded Canvas analysis of DLUHC, NHBC, ONS, and housebuilder annual reports. Last updated April 2026.
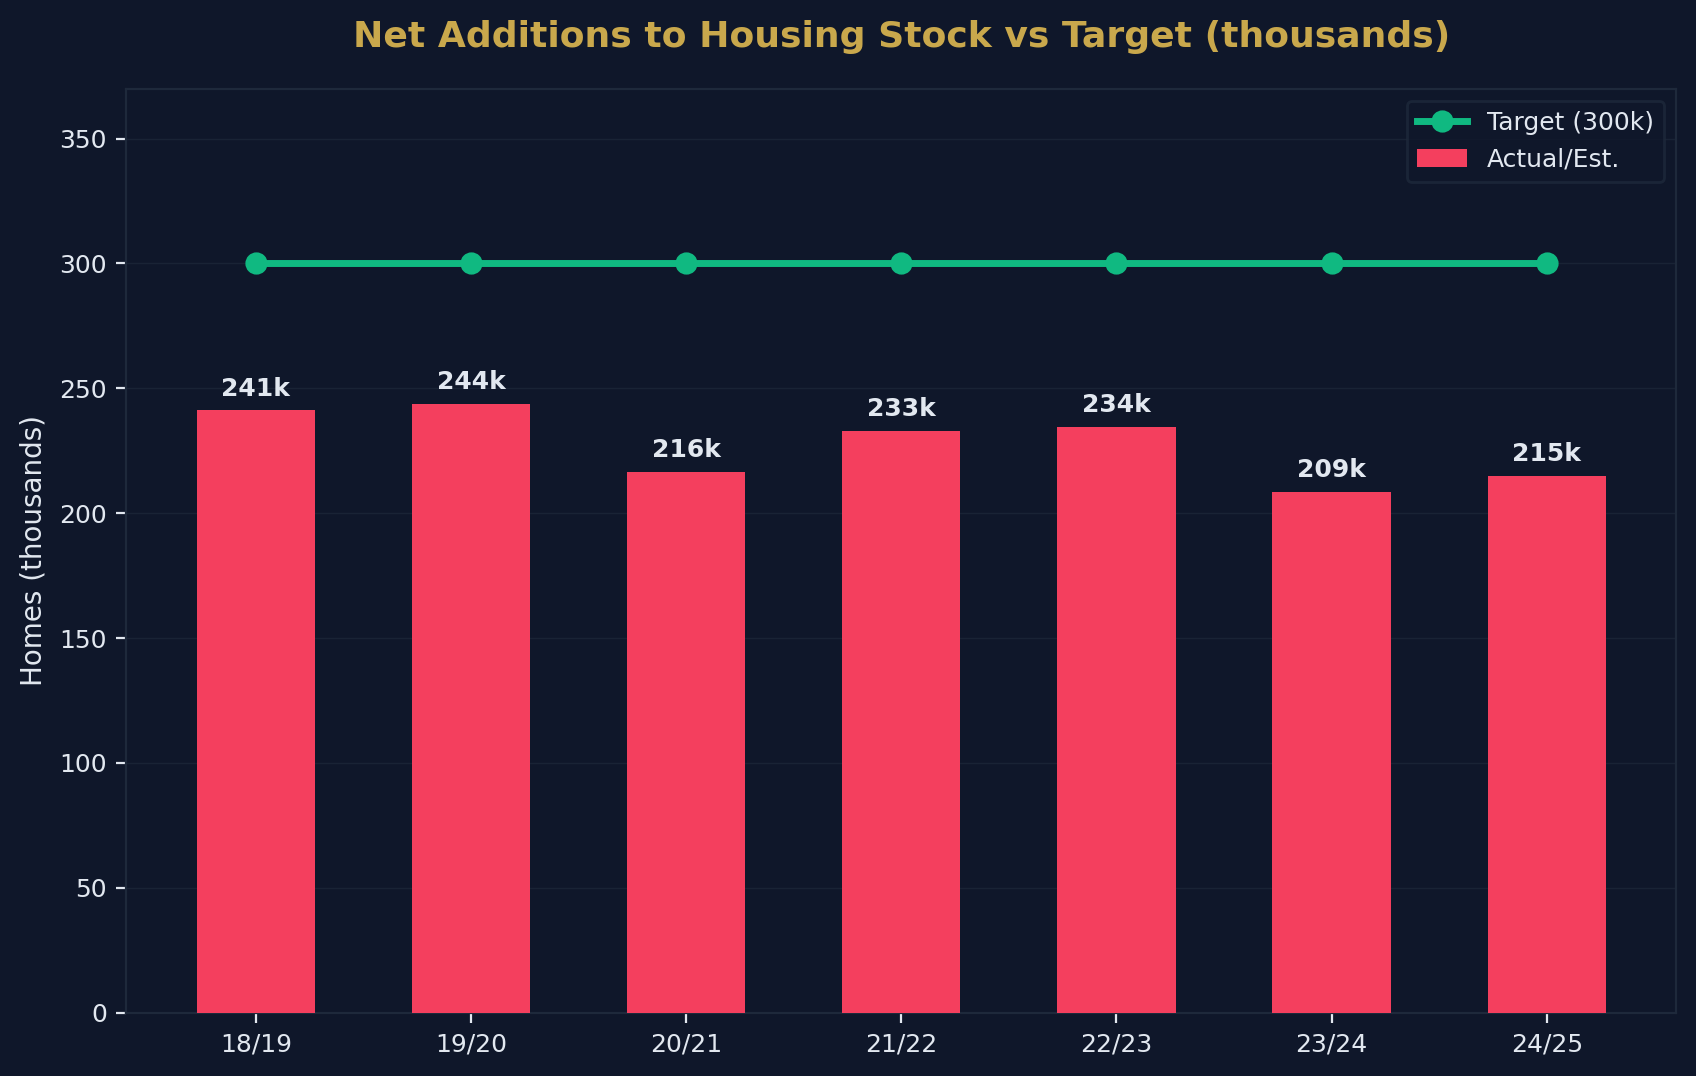
Net Additions to Housing Stock
Annual Net Additions (England)
| Year | Net Additions | Target | Shortfall | % of Target |
|---|---|---|---|---|
| 2018/19 | 241,130 | 300,000 | -58,870 | 80% |
| 2019/20 | 243,770 | 300,000 | -56,230 | 81% |
| 2020/21 | 216,490 | 300,000 | -83,510 | 72% |
| 2021/22 | 232,820 | 300,000 | -67,180 | 78% |
| 2022/23 | 234,400 | 300,000 | -65,600 | 78% |
| 2023/24 | 208,600 | 300,000 | -91,400 | 70% |
| 2024/25 | ~215,000 (est.) | 300,000 | -85,000 | 72% |
Components of Net Additions (2023/24)
| Component | Contribution |
|---|---|
| New build completions | ~180,000 |
| Conversions | ~16,000 |
| Change of use (permitted development) | ~12,000 |
| Demolitions | ~(-3,000) |
| Other | ~3,600 |
| Total | ~208,600 |
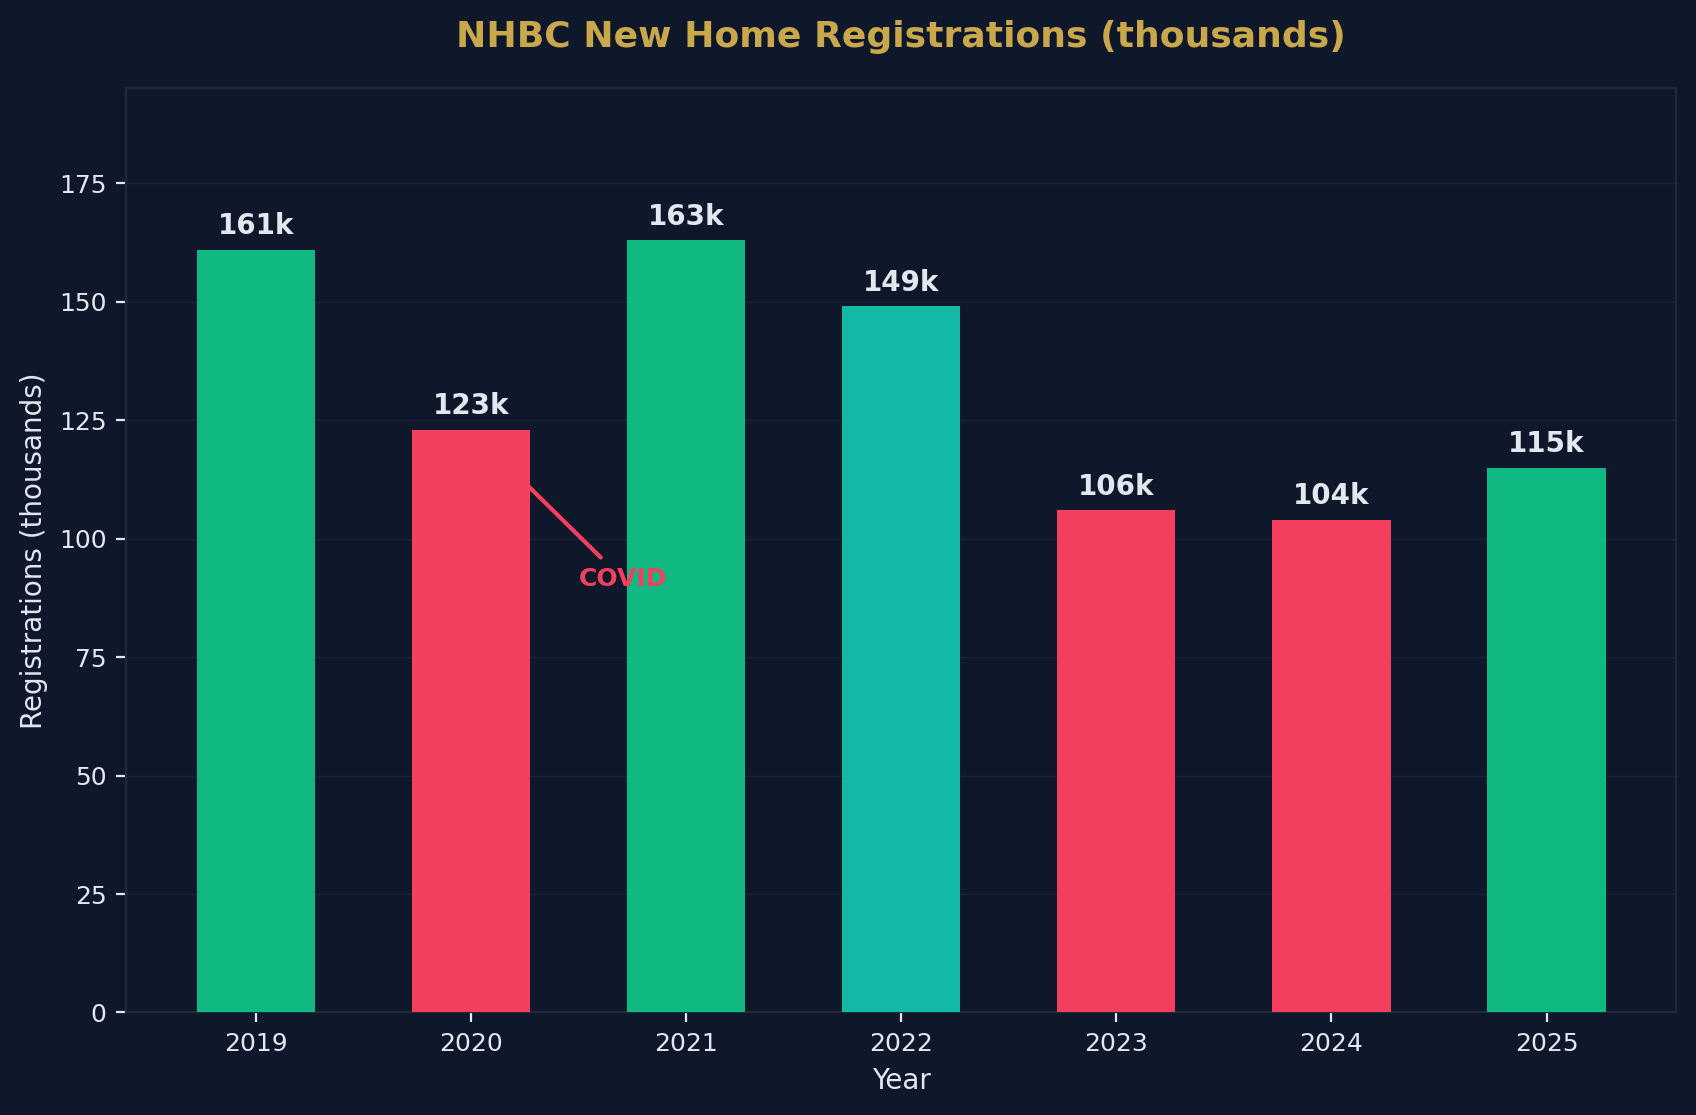
NHBC New Home Registrations
Annual Registrations
| Year | Registrations | YoY Change |
|---|---|---|
| 2019 | 161,022 | — |
| 2020 | 123,151 | -24% (COVID) |
| 2021 | 163,241 | +33% |
| 2022 | 148,828 | -9% |
| 2023 | 105,527 | -29% |
| 2024 | 103,669 | -2% |
| 2025 | 115,350 | +11% |
Regional Registration Performance (2025)
| Region | Trend |
|---|---|
| Most UK regions | Growth (+5–15%) |
| London | -27% — severe decline |
| <a href="/post/invest-in-scotland-property" style="color:#c9a84c;text-decoration:underline;font-weight:500">Scotland | Modest growth |
| Wales | Recovery |
London's 27% decline in registrations is driven by delays at the Building Safety Regulator (BSR), viability challenges for high-rise developments, and planning bottlenecks — raising concerns about the capital's medium-term housing pipeline.
Housebuilder Performance
Top UK Volume Housebuilders (2025)
| Builder | Completions (2025) | YoY Change | 2026 Target |
|---|---|---|---|
| Barratt Redrow | ~17,000 (est.) | Merger integration | ~18,000 |
| Persimmon | 11,905 | +12% | 12,043 |
| Taylor Wimpey | ~10,500 (est.) | Flat | ~11,000 |
| Bellway | 8,749 | +14.3% | ~9,200 |
| Vistry | ~8,000 (est.) | Partnership focus | ~8,500 |
| Berkeley | ~4,500 (est.) | London-focused | ~4,500 |
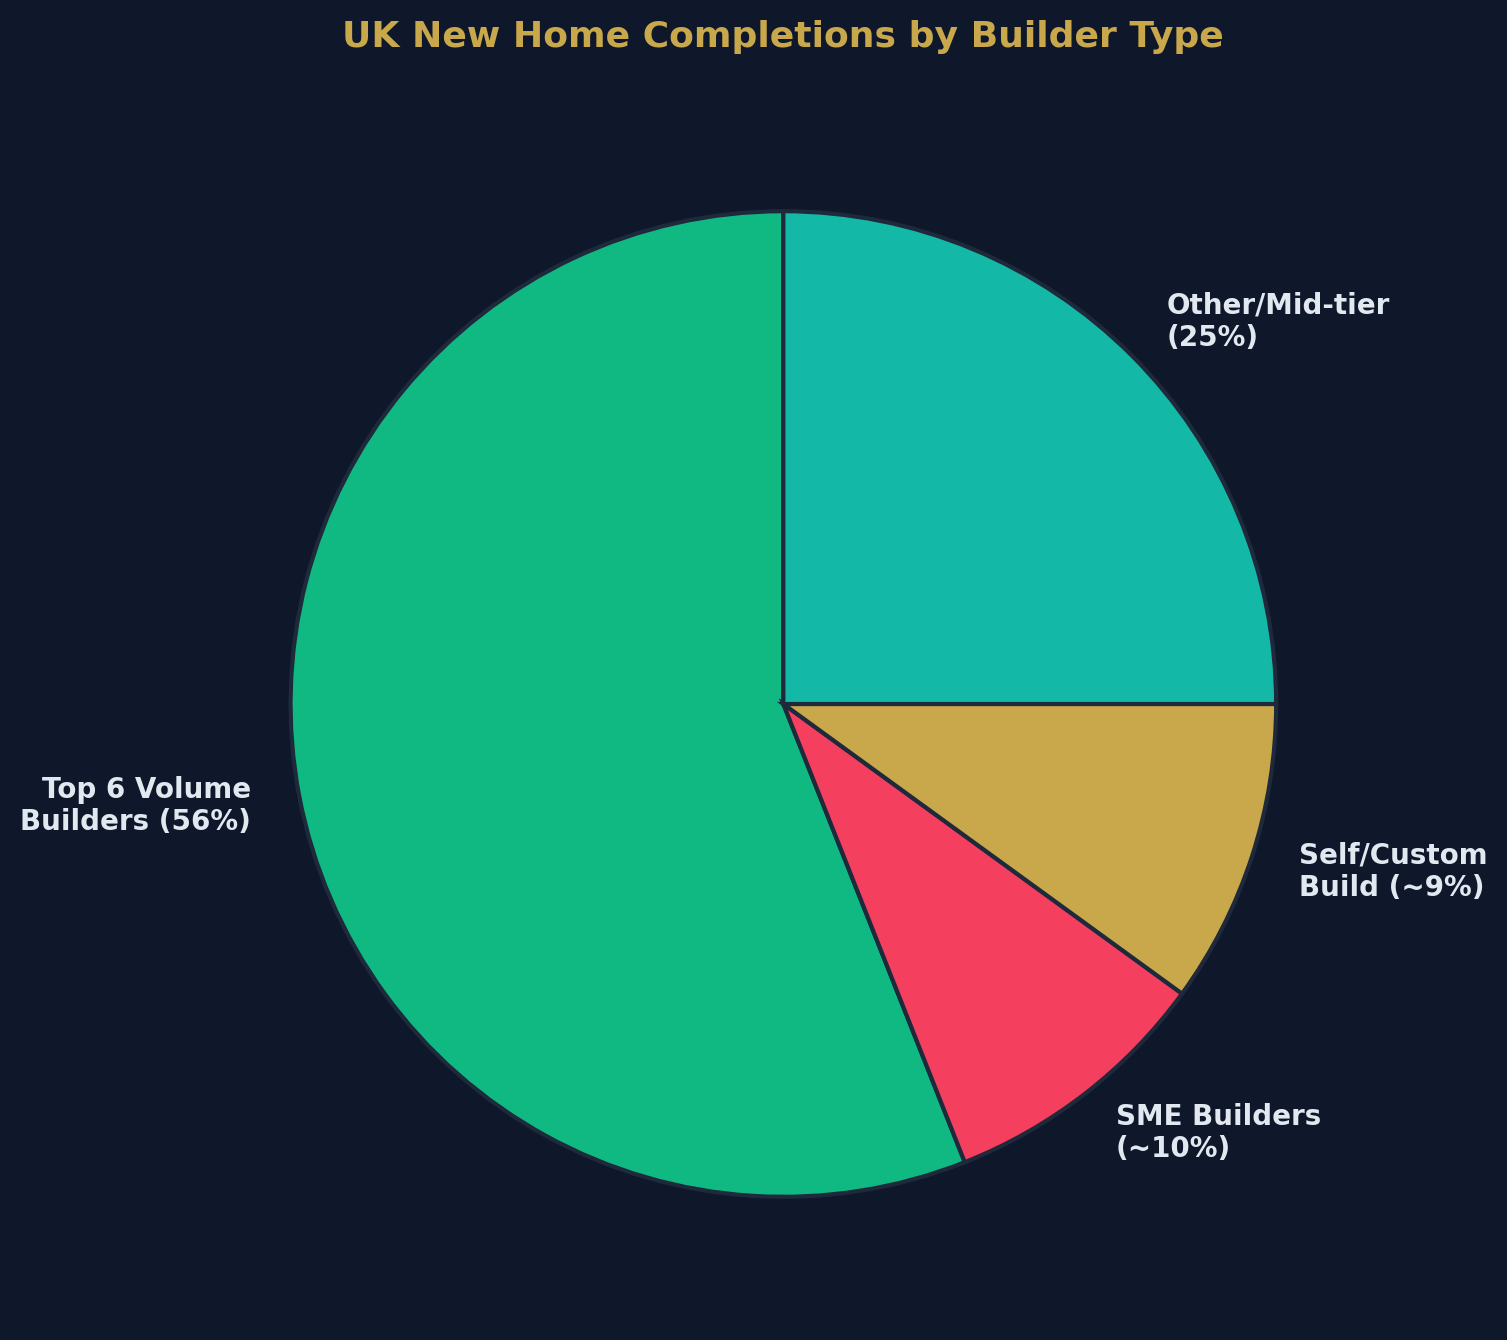
Market Concentration
| Metric | Figure |
|---|---|
| Top 6 builders' share of completions | ~56% |
| Top 10 builders' share | ~65% |
| SME builders' share | ~10% (down from ~40% in 2008) |
| Self/custom build share | ~7–10% |
The SME Builder Decline
The collapse of SME housebuilder output is one of the most significant structural changes in UK housing supply:
- In 2008, SME builders (producing <500 units/year) accounted for approximately 40% of new supply
- Today they account for approximately 10%
- The decline is driven by planning costs, regulatory complexity, and access to finance
- The government's mandatory housing targets are partly designed to revive SME building
Planning System
Planning Application Trends
| Year | Applications Decided | % Granted |
|---|---|---|
| 2019/20 | ~400,000 | 88% |
| 2020/21 | ~380,000 | 87% |
| 2021/22 | ~395,000 | 86% |
| 2022/23 | ~370,000 | 85% |
| 2023/24 | ~355,000 | 84% |
The Planning Bottleneck
The planning system is the primary constraint on housing supply. Key issues:
| Problem | Impact |
|---|---|
| Average application-to-decision time | 16+ weeks (major applications) |
| Planning officer vacancies | ~35% of councils report shortages |
| Nutrient neutrality requirements | ~145,000 homes blocked in affected areas |
| NPPF reforms | New mandatory targets reinstated late 2024 |
| Local Plan coverage | ~35% of councils lack an up-to-date Local Plan |
| Judicial review risk | Major schemes face 12–18 month delays |
From Permission to Completion
| Stage | Typical Duration |
|---|---|
| Pre-application consultation | 3–6 months |
| Planning application to decision | 4–12 months |
| Section 106/conditions discharge | 3–9 months |
| Construction | 12–24 months |
| Total pipeline | ~2–4 years |
Affordable Housing
Affordable Housing Delivery
| Year | Affordable Completions | Target (est.) | Shortfall |
|---|---|---|---|
| 2019/20 | 57,644 | ~90,000 | -32,356 |
| 2020/21 | 52,100 | ~90,000 | -37,900 |
| 2021/22 | 59,175 | ~90,000 | -30,825 |
| 2022/23 | 63,837 | ~90,000 | -26,163 |
| 2023/24 | ~55,000 (est.) | ~90,000 | -35,000 |
Affordable Housing by Type
| Type | Share |
|---|---|
| Affordable rent | ~45% |
| Social rent | ~12% |
| Shared ownership | ~20% |
| First Homes / discounted market | ~8% |
| Other intermediate | ~15% |
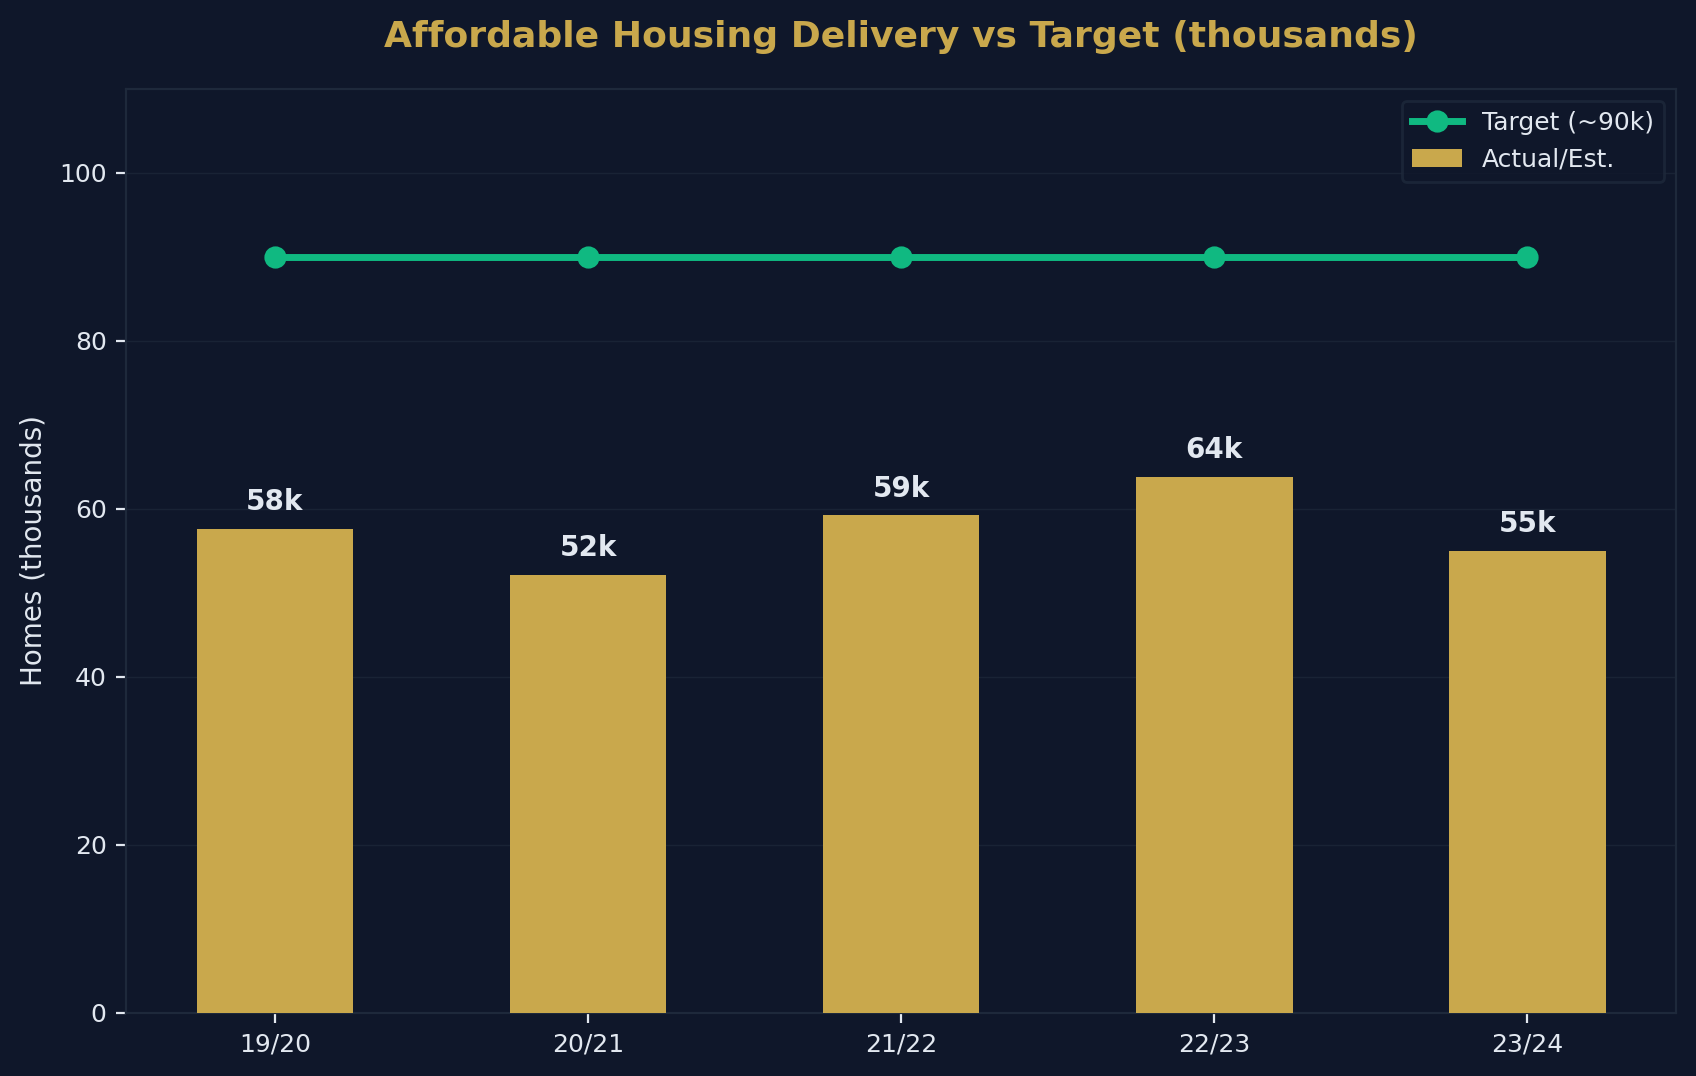
The chronic undersupply of social and affordable housing is the UK's most pressing housing challenge. Social rent delivery (at ~12% of affordable completions) is well below the levels needed to address the 1.3 million+ household social housing waiting list.
The Cumulative Supply Gap
Estimated Undersupply (2015–2026)
| Period | Cumulative Net Additions | Cumulative Target | Cumulative Shortfall |
|---|---|---|---|
| 2015–2020 | ~1,100,000 | 1,500,000 | ~400,000 |
| 2020–2026 | ~1,350,000 | 1,800,000 | ~450,000 |
| Total (2015–2026) | ~2,450,000 | ~3,300,000 | ~850,000 |
Why the Supply Gap Supports Property Prices
The structural undersupply creates a price floor:
- Demand exceeds supply by 80,000–100,000 homes per year
- Household formation continues at ~220,000–250,000 per year
- Net migration (though reducing) adds further demand
- Social housing exits push households into the private sector
- Even during recessions, the shortage prevents significant price falls
For property investors, this undersupply is the fundamental reason why UK residential property has been the most resilient major asset class over the past 30 years. With so little new stock reaching the open market, a growing number of investors source off-market opportunities through deal packaging services instead.
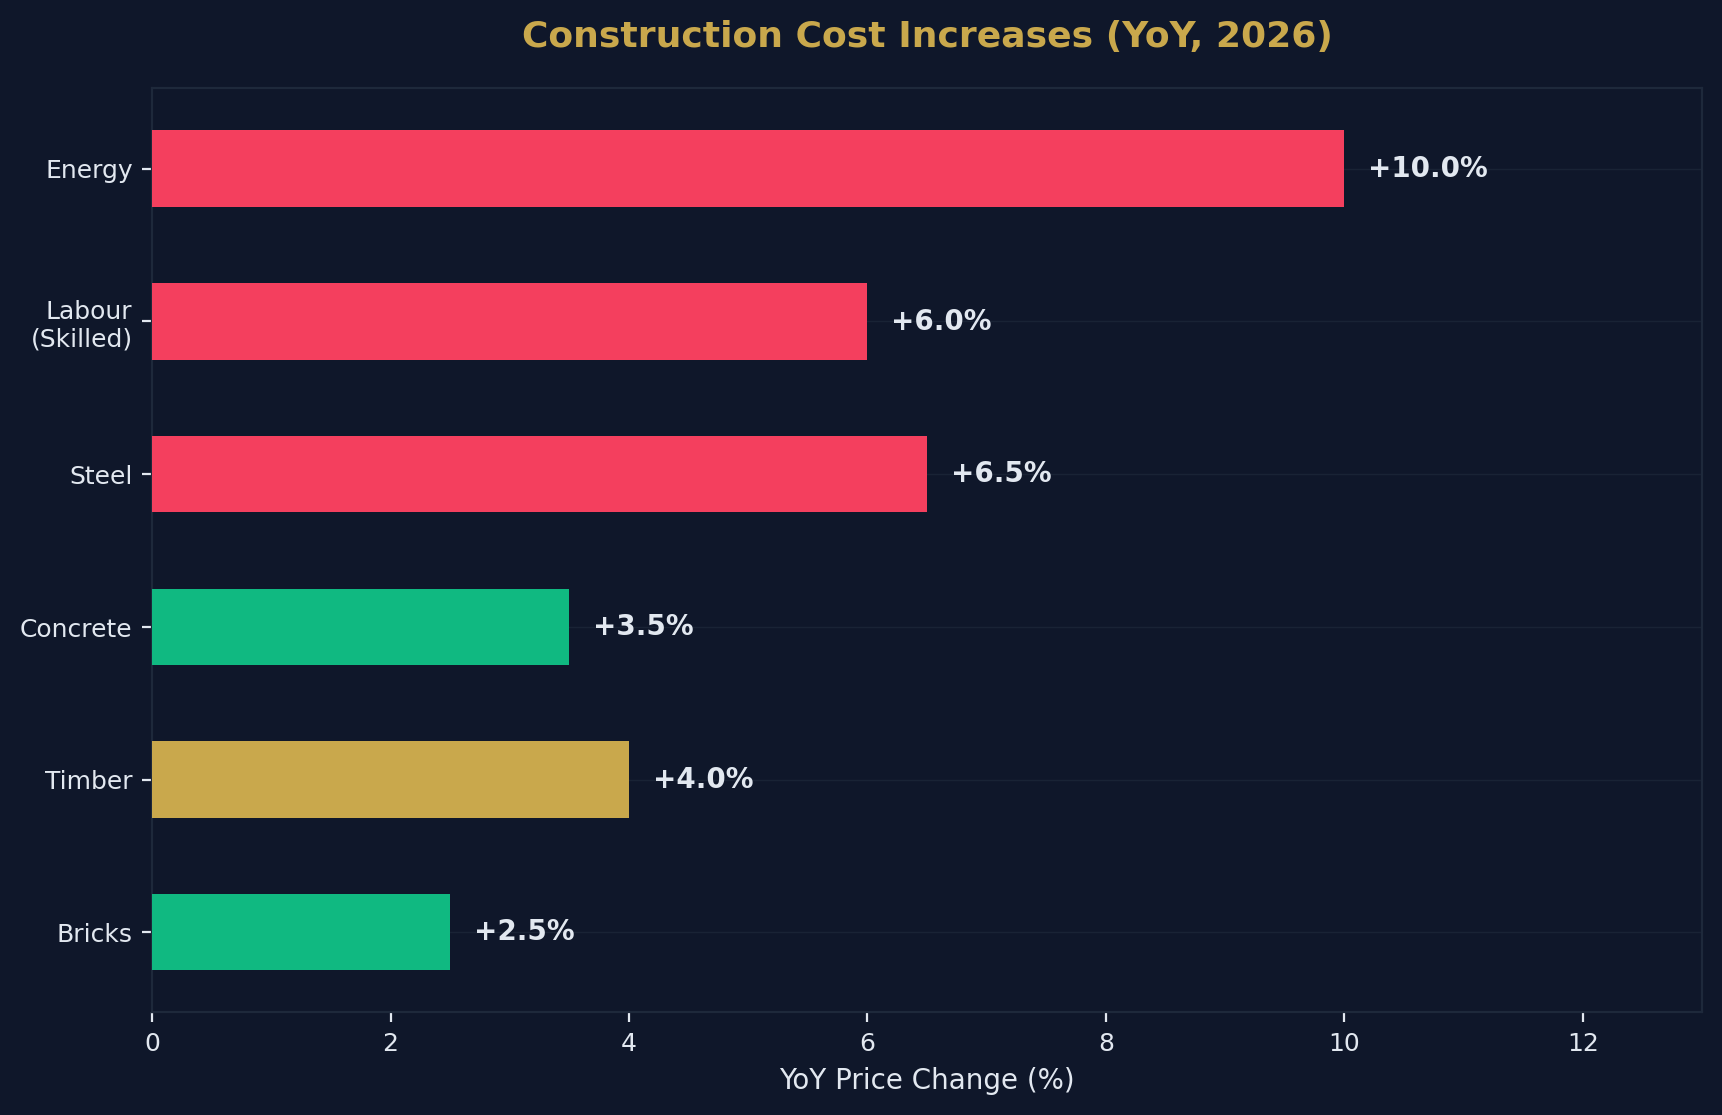
Construction Costs and Materials
Building Cost Index (2026)
| Material | YoY Price Change |
|---|---|
| Timber | +3–5% |
| Steel | +5–8% |
| Concrete/aggregates | +3–4% |
| Bricks | +2–3% |
| Labour (skilled trades) | +5–7% |
| Energy (construction) | +8–12% |
Rising construction costs — particularly labour and energy — are squeezing developer margins and contributing to reduced output. The ongoing geopolitical tensions have added further upward pressure on material costs.
Methodology and Data Sources
| Source | Data Type | Coverage |
|---|---|---|
| DLUHC | Net additions, planning statistics | England |
| NHBC | New home registrations, completions | UK |
| ONS | Construction output | UK |
| Housebuilder annual reports | Company completions | UK |
| RICS | Construction market survey | UK |
| Homes England | Affordable housing delivery | England |
How to Cite This Page
UK Housing Supply Statistics 2026. Shaded Canvas. Published April 2026, updated quarterly. Available at: https://blog.shadedcanvas.co.uk/post/uk-housing-supply-statistics-2026
Stop being a landlord. Start being an investor.
Shaded Canvas introduces serious capital to vetted UK property opportunities — targeting 12–16% net returns.
Start Investing →