Where are UK house prices heading over the next five years? This page consolidates every major forecast from Savills, JLL, Knight Frank, the OBR, and the Bank of England into a single, data-driven reference — covering house prices, rental growth, interest rates, housing supply, and regional divergence through to 2030.
Whether you are an investor timing your next acquisition, a homeowner deciding whether to hold or sell, or an analyst tracking macroeconomic trends, this is the most comprehensive forecast summary available.
Last Updated: April 2026 | Next Update: July 2026
Key Forecast Statistics at a Glance
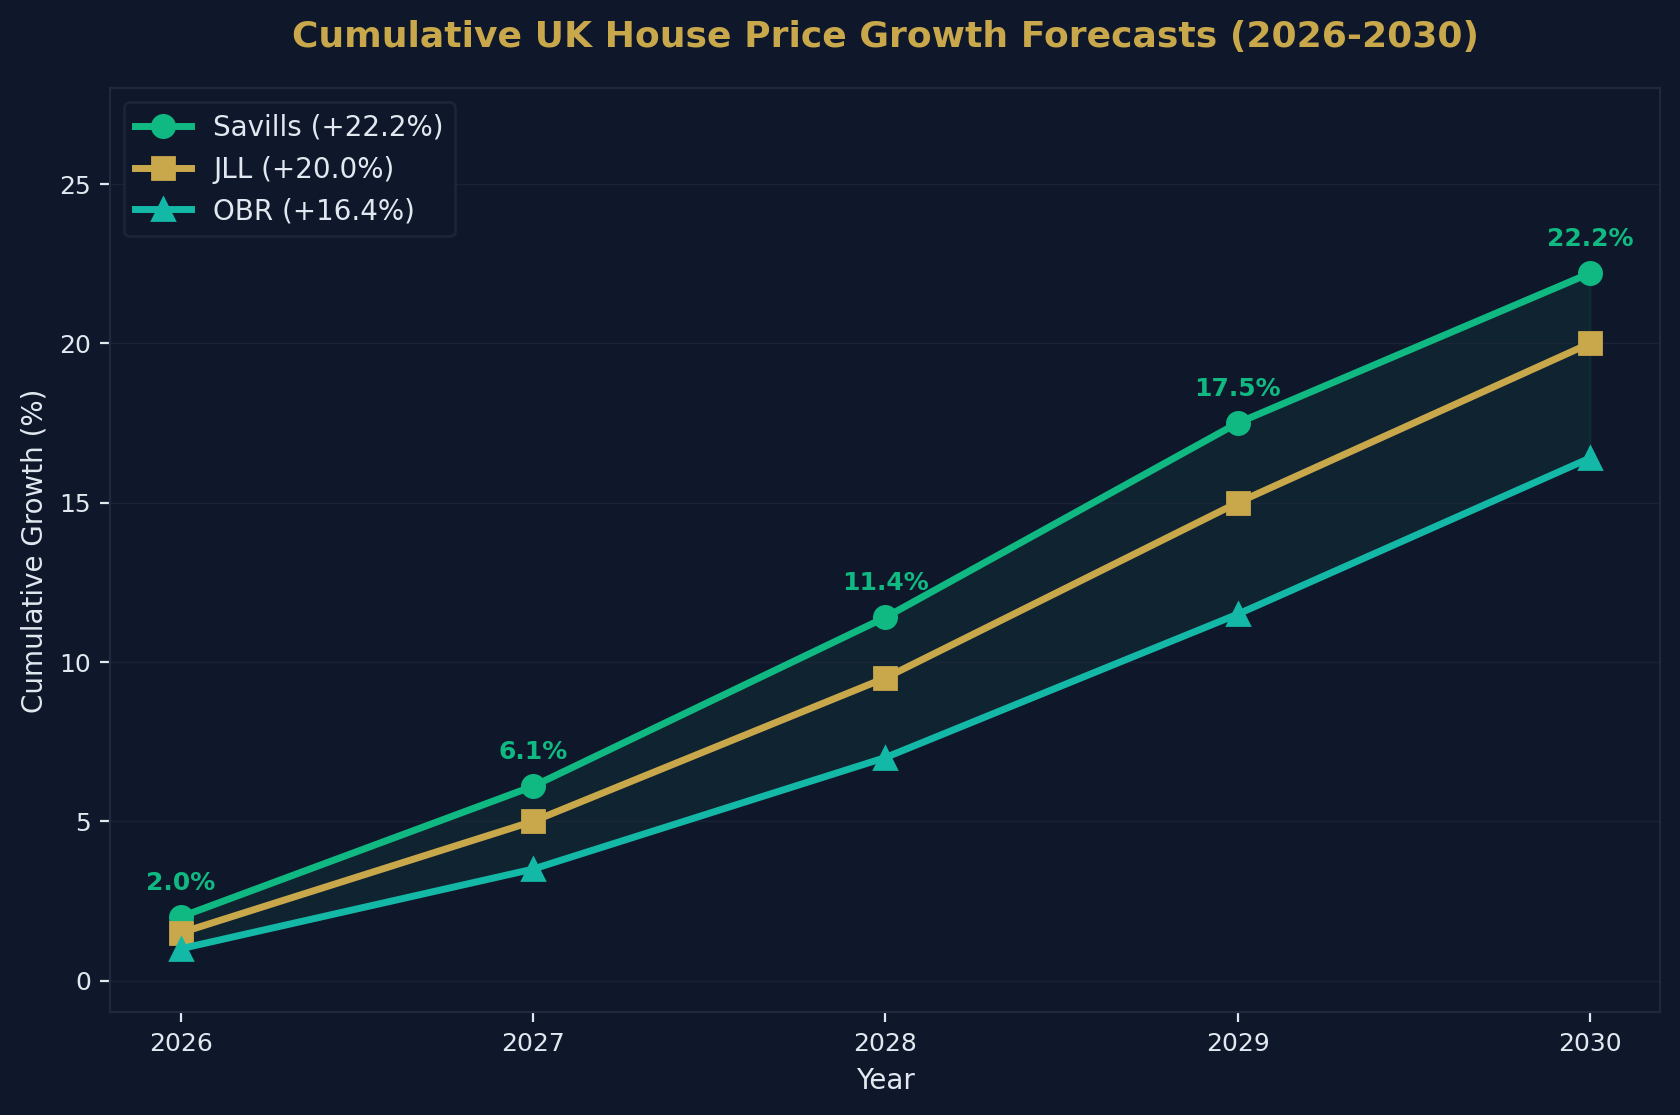
- Savills forecasts 22.2% cumulative UK house price growth by 2030.
- JLL projects approximately 20% cumulative growth over the same period.
- The OBR forecasts a cumulative increase of 16.4% by 2030–31.
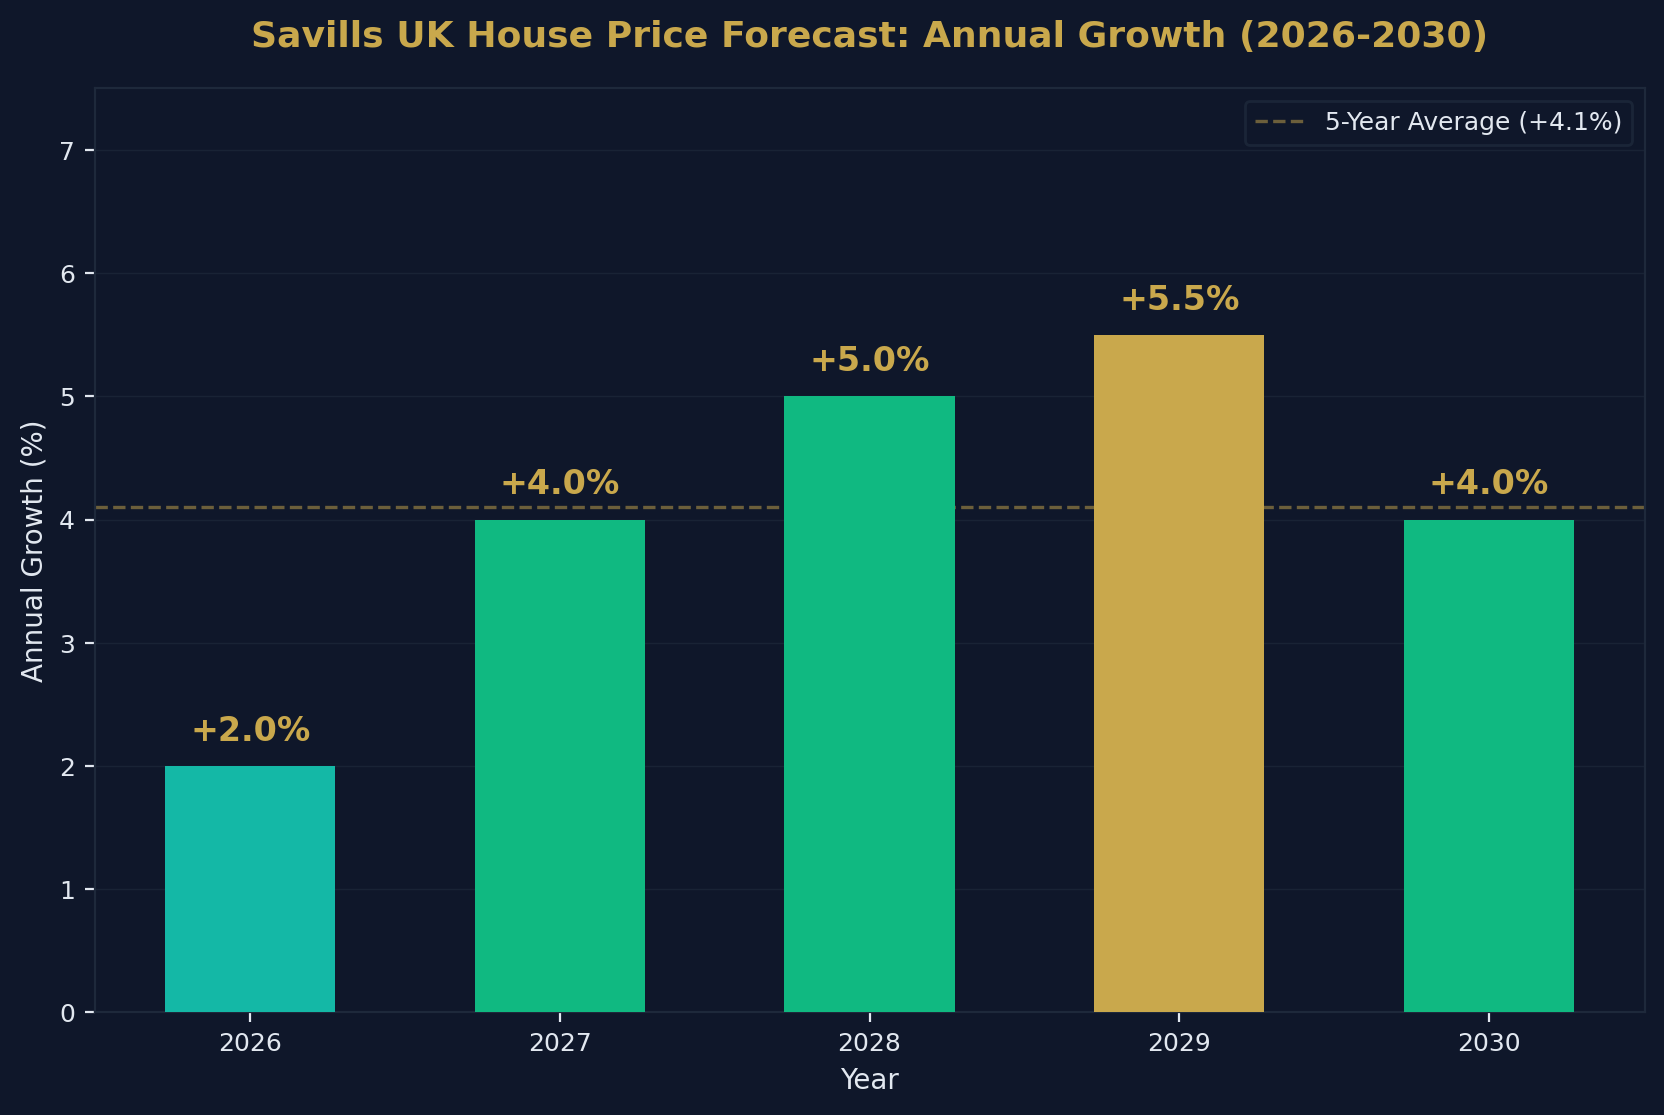
- Peak annual growth is expected in 2029 at +5.5% (Savills).
- UK house price growth in 2026 is forecast at a modest +2.0%.
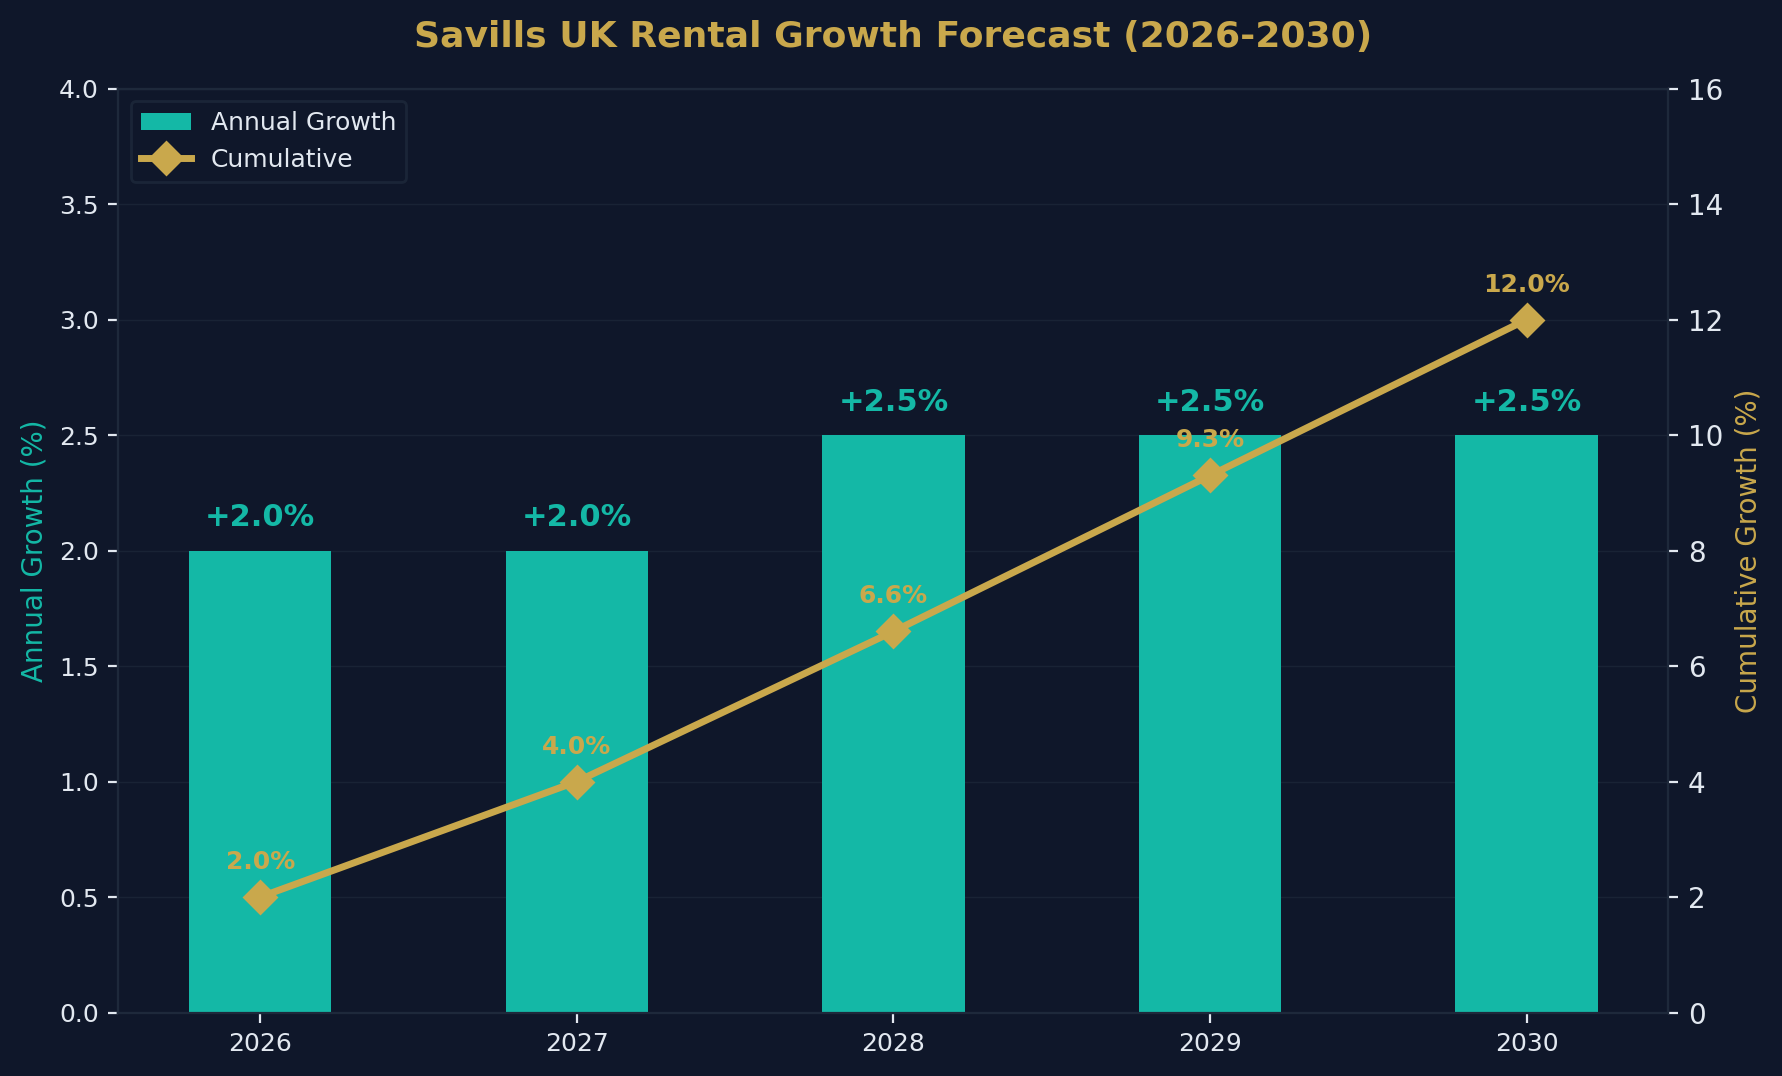
- Savills projects cumulative rental growth of 12% over 2026–2030.
- Annual rental growth is expected to settle between 2.0% and 2.5% — a significant deceleration from 6%+ in 2023.
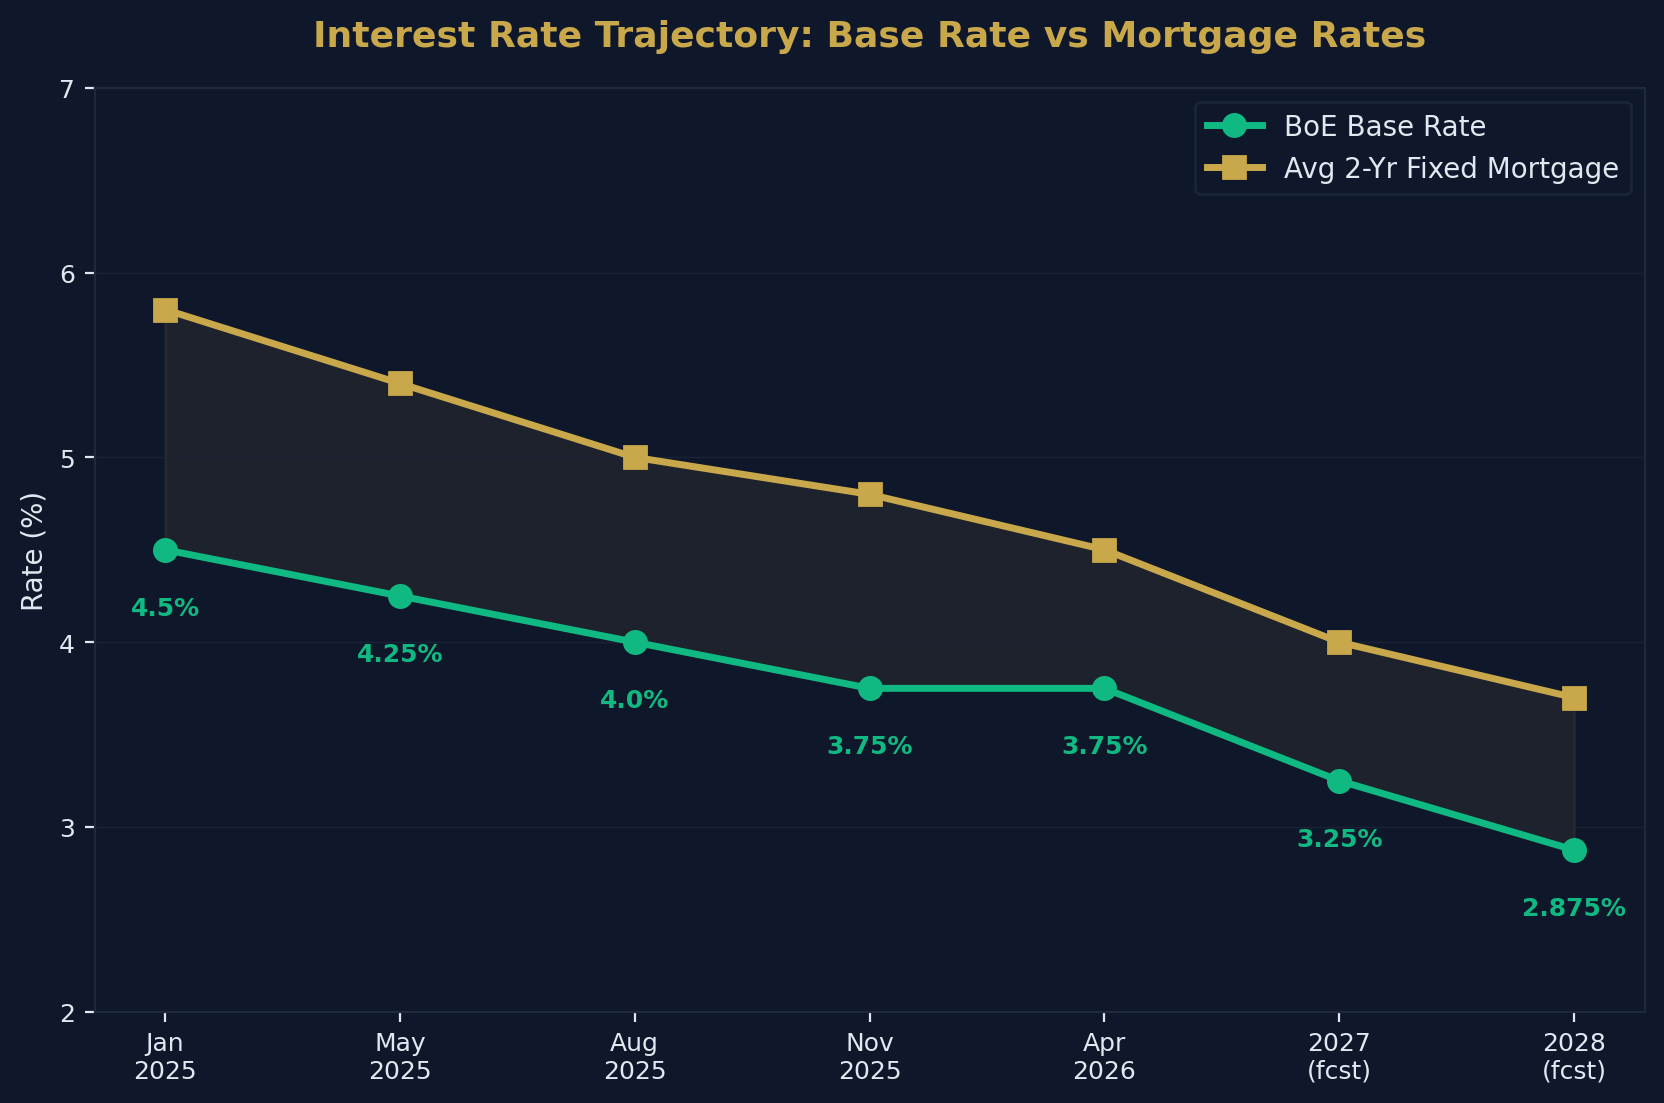
- The Bank of England base rate is currently 3.75% (April 2026) — analysts expect it to trend toward 2.5–3.5% by 2028.
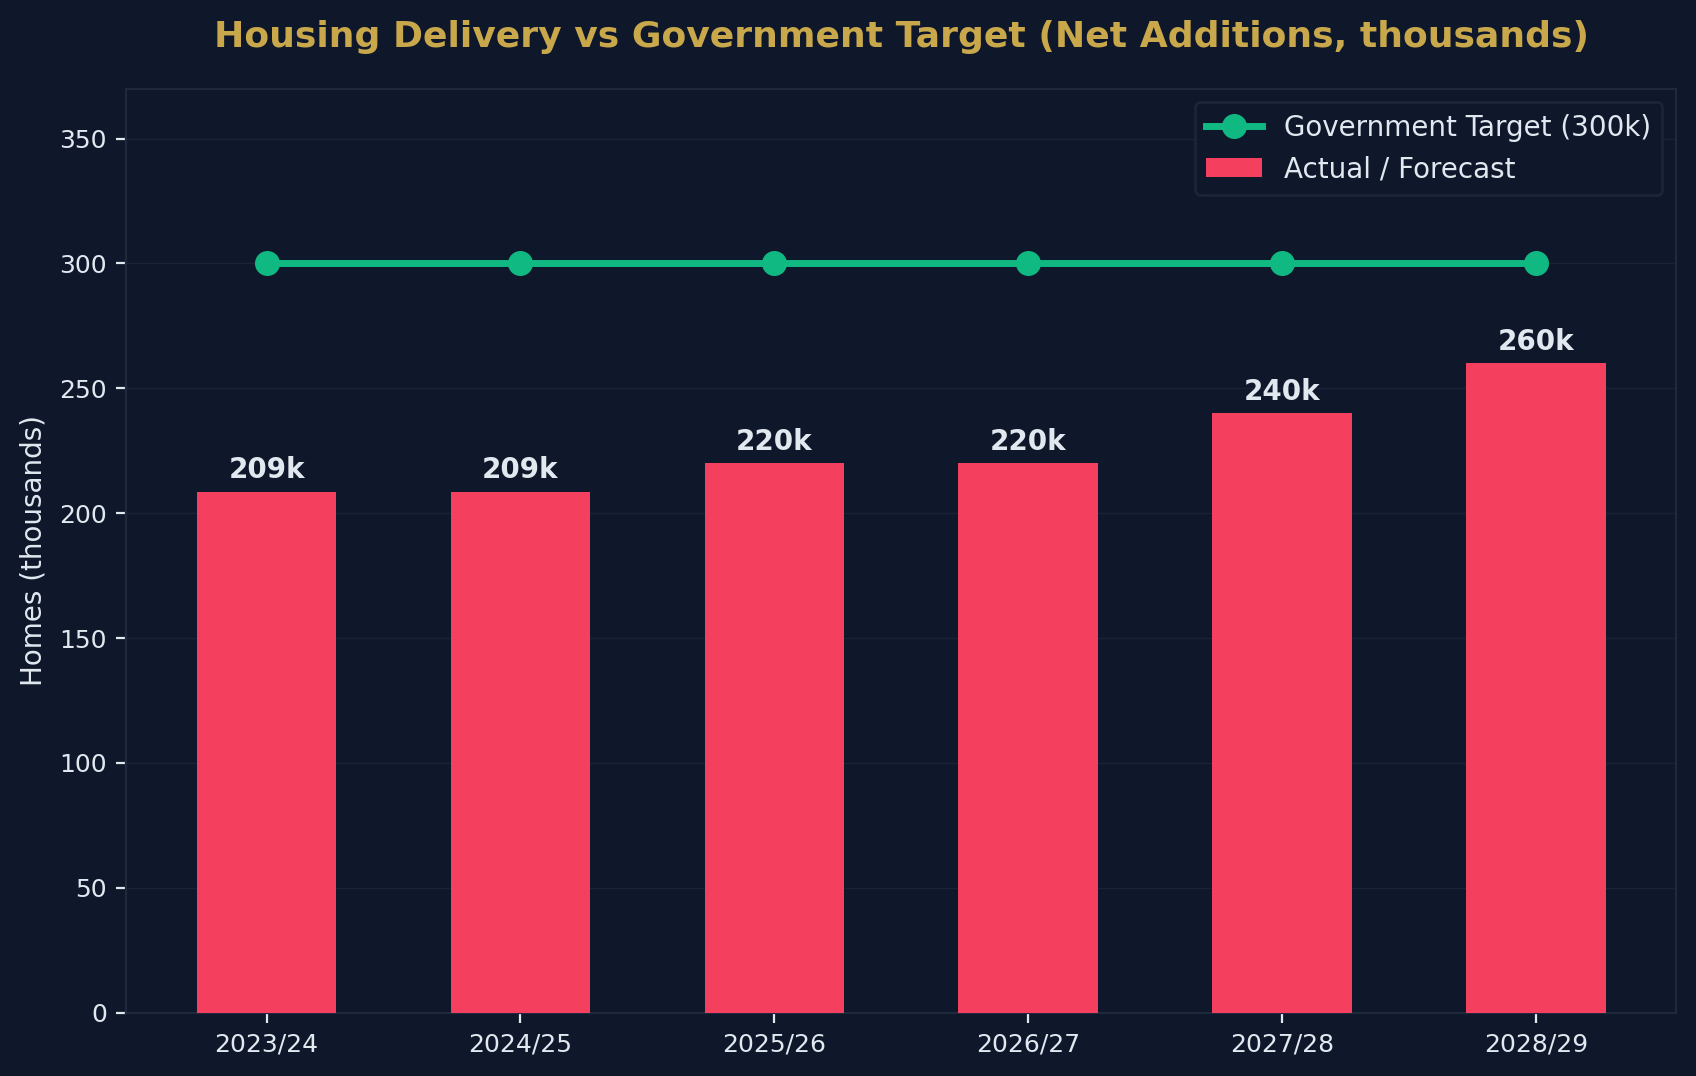
- The government targets 1.5 million new homes by the end of the current parliament (2029).
- Current housing delivery stands at approximately 208,600 net additions per year — well below the 300,000 annual target.
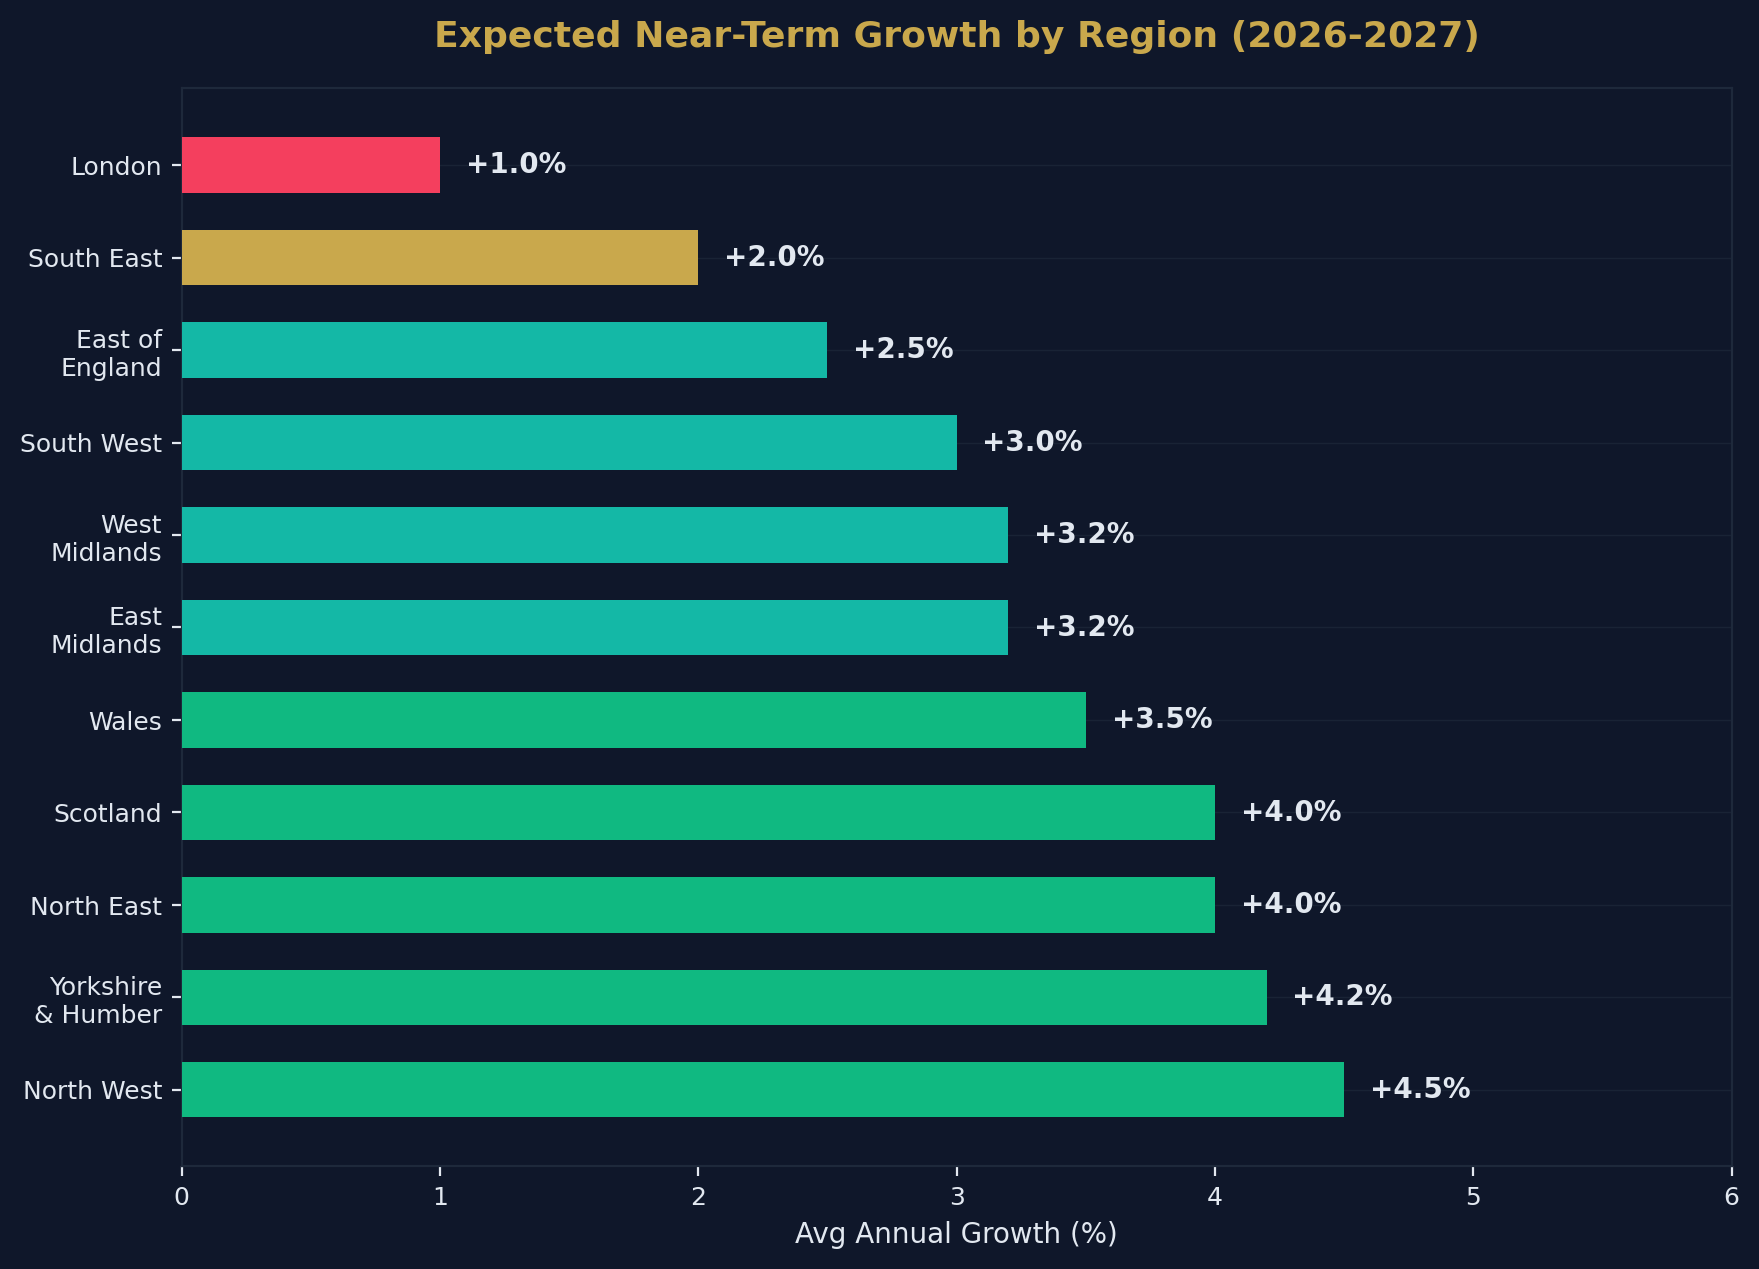
- Northern regions and Scotland are expected to outperform London and the South East in the near term.
- London and the South East are forecast to see stronger growth from 2028 onwards as affordability improves.
- Building costs are forecast to rise approximately 15% over the next five years.
- Planning reforms are expected to take practical effect from late 2026 into 2027.
- The UK housing market remains structurally undersupplied — the primary long-term price floor.
Source: Shaded Canvas analysis of Savills, JLL, Knight Frank, OBR, Bank of England, ONS, and RICS data. Last updated April 2026. Cite as: "UK Property Market Forecast 2026–2030, Shaded Canvas (blog.shadedcanvas.co.uk)."
House Price Forecasts: The Consensus View
The UK property market is expected to deliver cumulative growth of approximately 16–22% over the 2026–2030 period, depending on which forecaster you follow. The trajectory is consistent across all major analysts: modest growth in 2026, accelerating through 2028–2029 as interest rates fall and affordability improves.
Savills Five-Year Forecast (Mainstream Residential)
| Year | Annual Growth | Cumulative Growth |
|---|---|---|
| 2026 | +2.0% | 2.0% |
| 2027 | +4.0% | 6.1% |
| 2028 | +5.0% | 11.4% |
| 2029 | +5.5% | 17.5% |
| 2030 | +4.0% | 22.2% |
Savills identifies three primary drivers: falling interest rates improving mortgage affordability, a persistent structural undersupply of housing, and wage growth outpacing house price growth — restoring affordability ratios toward long-run averages.
JLL Five-Year Forecast
JLL projects approximately 20% cumulative growth over the same period. Their view aligns closely with Savills but places slightly greater emphasis on the near-term headwinds from affordability pressures in 2026. JLL expects more affordable regions — particularly the North West — to lead growth in the early years, with London and the South East strengthening from 2028 onwards.
OBR Forecast
The Office for Budget Responsibility projects a cumulative house price increase of 16.4% by 2030–31 — the most conservative of the three major forecasts. The OBR's lower projection reflects its mandate to account for downside risks including fiscal tightening, higher-for-longer interest rates, and potential labour market softening.
Knight Frank View
Knight Frank has adopted a more cautious stance, citing high supply levels in the new-build market and evolving tax policies as near-term headwinds. However, they acknowledge that structural supply shortages should underpin values over the medium term as interest rates ease.
Regional Divergence: Where Will Growth Be Strongest?
One of the most consistent themes across all forecasters is regional divergence. Northern regions, Scotland, and Wales are expected to outperform London and the South East in the near term, while the capital is forecast to lead growth in the latter years of the forecast.
Expected Regional Performance (2026–2030)
| Region | Near-Term (2026–2027) | Medium-Term (2028–2030) | Overall Outlook |
|---|---|---|---|
| North West | Strong | Moderate | Above average |
| Yorkshire & Humber | Strong | Moderate | Above average |
| North East | Strong | Moderate | Above average |
| Scotland | Strong | Moderate | Above average |
| Wales | Moderate | Moderate | Average |
| East Midlands | Moderate | Moderate | Average |
| West Midlands | Moderate | Moderate | Average |
| South West | Moderate | Moderate-Strong | Average |
| East of England | Moderate | Strong | Average |
| South East | Weak-Moderate | Strong | Average |
| London | Weak | Strong | Below average early, strong late |
Why Northern Regions Lead Early
Three factors explain the northern outperformance:
- Affordability gap: Northern regions have significantly lower price-to-earnings ratios (3–4x vs 7–12x in the South), meaning further price growth is supported by fundamentals
- Yield compression: Institutional investors increasingly target northern cities for BTL portfolios, driving demand
- Remote working: The structural shift toward hybrid working has permanently expanded the buyer pool for northern cities with strong transport links
Why London Catches Up Later
London's recovery is expected to lag because:
- Affordability overhang: At 12x+ earnings, London prices need wage growth to close the affordability gap before meaningful price growth can resume
- <a href="/post/stamp-duty-on-buy-to-let" style="color:#c9a84c;text-decoration:underline;font-weight:500">SDLT impact: The 2025 SDLT threshold reduction disproportionately affected London buyers
- Supply pipeline: London has a large development pipeline that is currently suppressing price growth
However, from 2028 onwards, as interest rates fall toward 2.5–3.5% and global capital flows resume, London is expected to benefit from its status as a global financial centre and safe-haven asset market.
Interest Rate and Mortgage Market Outlook
The path of interest rates is the single most important variable for the UK property market over the next five years. Every major forecaster identifies the Bank of England's rate trajectory as the primary driver of housing demand.
Base Rate Trajectory
| Date | Base Rate | Direction |
|---|---|---|
| January 2025 | 4.50% | — |
| February 2025 | 4.50% | Hold |
| May 2025 | 4.25% | Cut |
| August 2025 | 4.00% | Cut |
| November 2025 | 3.75% | Cut |
| April 2026 | 3.75% | Hold |
| 2027 (forecast) | 3.00–3.50% | Expected cuts |
| 2028 (forecast) | 2.50–3.25% | Expected cuts |
Mortgage Rate Implications
Current average mortgage rates (April 2026):
- 2-year fixed (75% LTV): ~4.5%
- 5-year fixed (75% LTV): ~4.2%
- Effective rate on new drawdowns: 4.10%
As the base rate trends lower through 2027–2028, mortgage rates are expected to follow — potentially reaching the high 3s for competitive fixed products. This improvement in borrowing costs directly translates to increased purchasing power, supporting both house prices and transaction volumes.
Key Risk: Geopolitical Uncertainty
The escalation of the Middle East conflict in early 2026 has introduced significant uncertainty into interest rate forecasts. Higher energy and commodity prices threaten to reignite inflation, which could delay or reverse expected rate cuts. Analysts now acknowledge that the base rate could remain at 3.75% for the remainder of 2026 — or potentially increase if inflation pressures intensify.
Rental Market Forecast
The UK rental market is transitioning from the extraordinary growth of 2022–2024 (6%+ annually) to a more sustainable trajectory aligned with wage growth.
Savills Rental Growth Forecast
| Year | Annual Rental Growth | Cumulative Growth |
|---|---|---|
| 2026 | +2.0% | 2.0% |
| 2027 | +2.0% | 4.0% |
| 2028 | +2.5% | 6.6% |
| 2029 | +2.5% | 9.3% |
| 2030 | +2.5% | 12.0% |
Drivers of Rental Market Moderation
The deceleration from 6%+ growth to 2–2.5% reflects several converging forces:
- Affordability ceiling: Rents have reached levels where further growth is constrained by tenant incomes — particularly in London, where the rent-to-income ratio has peaked
- Net migration decline: The reduction in net migration from pandemic-era peaks has eased demand pressure
- Home ownership transition: Improved mortgage conditions have allowed more renters — particularly first-time buyers — to exit the rental market
Supply-Side Risks
Despite the demand moderation, structural supply constraints persist:
- Landlord exit: The Renters' Rights Act and ongoing tax reforms continue to pressure smaller BTL landlords to sell
- Regulatory burden: Increased compliance costs reduce net yields, deterring new investment
- Build-to-Rent growth: Institutional BTR investment provides some new supply but remains concentrated in major cities
The net effect: rental growth will be moderate but persistent, underpinned by a market that remains structurally undersupplied.
Housing Supply and the 1.5 Million Target
The government's target of 1.5 million new homes by the end of the current parliament is the most ambitious housing delivery goal in modern British political history. The data suggests it is unlikely to be achieved.
Housing Delivery vs Target
| Year | Net Additions (Actual/Forecast) | Annual Target | Shortfall |
|---|---|---|---|
| 2023/24 | ~208,600 | 300,000 | -91,400 |
| 2024/25 | ~208,600 | 300,000 | -91,400 |
| 2025/26 | ~220,000 (est.) | 300,000 | -80,000 |
| 2026/27 | ~220,000 (forecast) | 300,000 | -80,000 |
| 2027/28 | ~240,000 (forecast) | 300,000 | -60,000 |
| 2028/29 | ~260,000 (forecast) | 300,000 | -40,000 |
Why the Target Will Likely Be Missed
Three structural barriers explain the persistent shortfall:
Planning system capacity: Despite reforms (Planning and Infrastructure Act 2025, revised NPPF), local authority planning departments lack the staffing and funding to process applications at the required pace. Meaningful impact is not expected until late 2026 at earliest.
Construction sector constraints: Skills shortages, rising building costs (+15% forecast over 5 years), and building safety regulations slow delivery timelines.
Development viability: Higher interest rates and construction costs reduce profit margins, making some sites uneconomic. Developers are increasingly selective about which sites to bring forward.
Investment Implications of the Supply Shortfall
The persistent gap between supply and demand is the fundamental long-term price floor for UK property. Even if economic conditions soften temporarily, the structural undersupply of homes — estimated at 100,000–150,000 per year relative to household formation — prevents significant price declines.
For investors, this dynamic creates a clear strategic thesis: UK property values are underpinned by supply constraints that no realistic policy intervention can resolve within the forecast horizon.
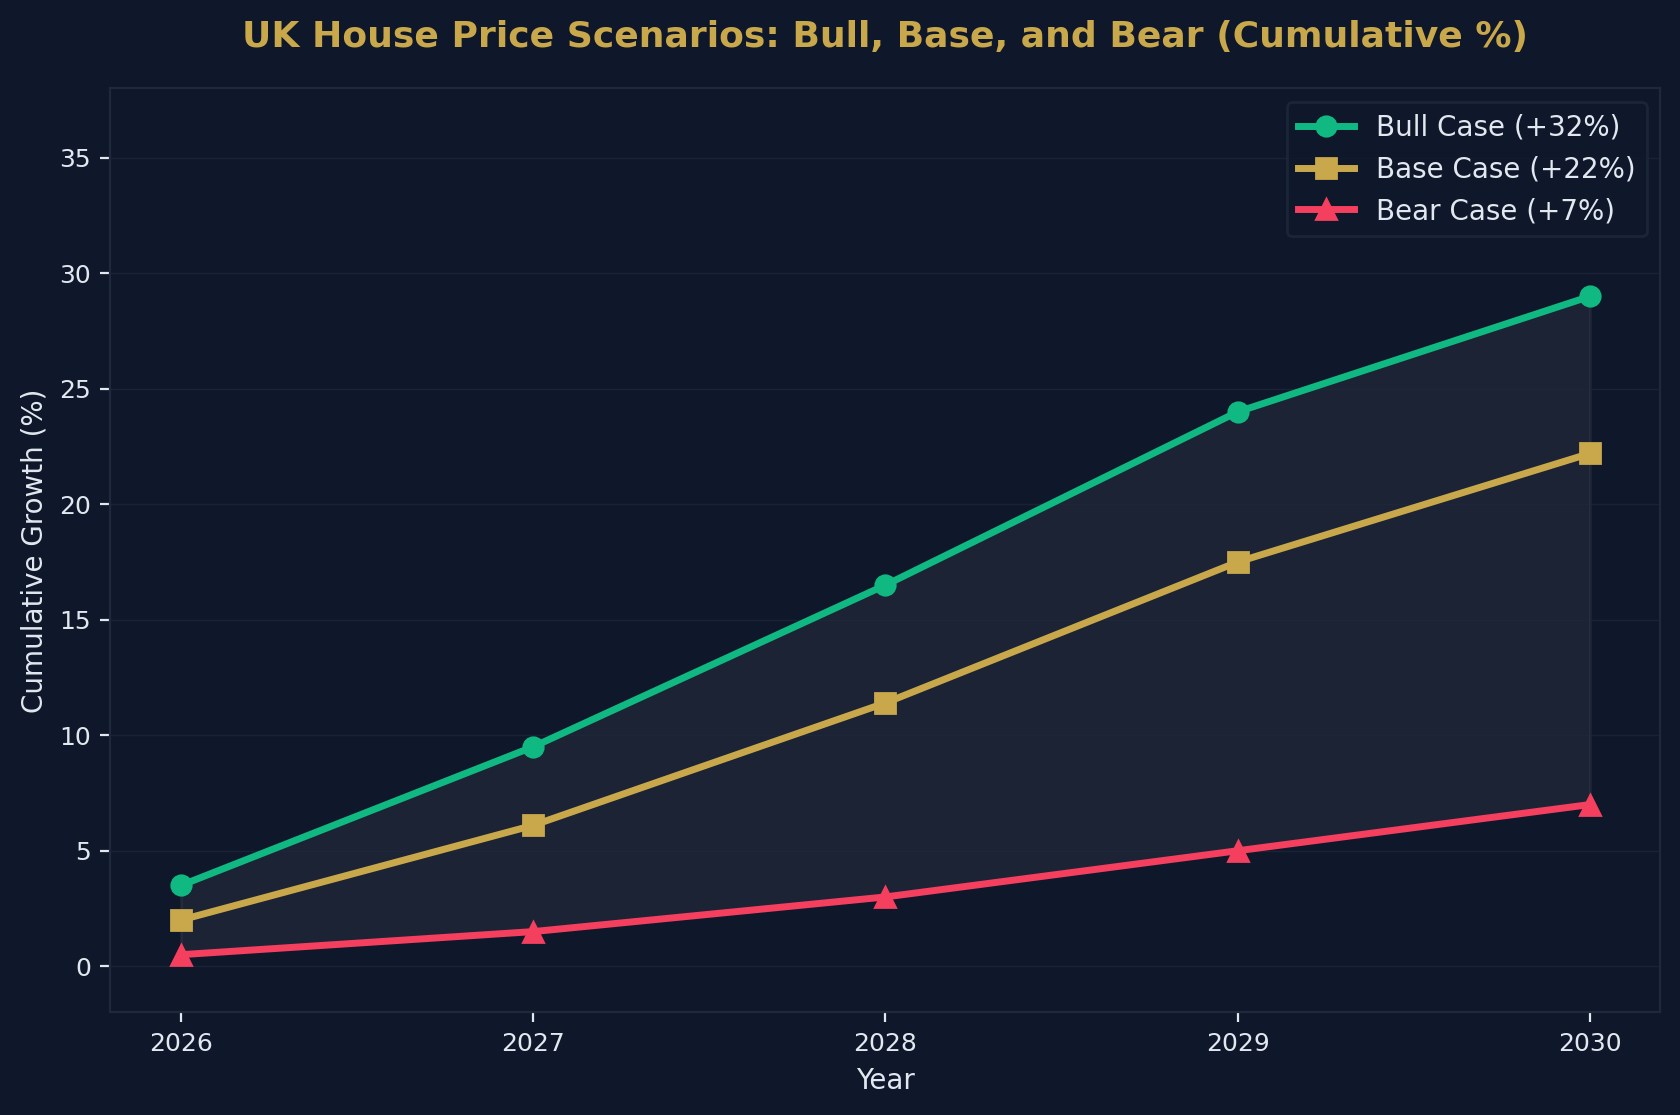
Scenarios: Bull, Base, and Bear Cases
Bull Case (Cumulative +25–30% by 2030)
- Bank of England cuts to 2.0–2.5%
- Wage growth exceeds 4% annually
- International capital returns aggressively to UK market
- Planning reforms deliver accelerated supply from 2027
Base Case (Cumulative +18–22% by 2030)
- Gradual rate cuts to 2.5–3.5%
- Moderate wage growth of 3–4%
- Steady transaction volumes
- Supply remains constrained at 220,000–260,000 per year
Bear Case (Cumulative +5–10% by 2030)
- Rates remain at 3.75% or rise due to inflation resurgence
- Recession triggers unemployment spike
- Geopolitical instability disrupts global capital flows
- Regulatory burden accelerates landlord exit, creating localised oversupply
Key Risks to Monitor
| Risk Factor | Probability | Impact | Monitoring Source |
|---|---|---|---|
| Inflation resurgence (energy/commodity) | Medium-High | High | ONS CPI, BoE MPC minutes |
| Geopolitical escalation | Medium | High | Energy futures, bond markets |
| Recession / unemployment rise | Low-Medium | Very High | ONS labour market data |
| Regulatory overreach (Renters' Rights Act) | Medium | Medium | Parliamentary tracker |
| Planning reform failure | Medium | Medium | DLUHC quarterly stats |
| Global capital flight from UK | Low | High | CBRE/JLL capital flows reports |
What This Means for Different Stakeholders
For Investors
The base case of 18–22% cumulative growth, combined with 12% rental growth, suggests total returns of approximately 30–35% over the forecast period for a leveraged buy-to-let portfolio. Northern cities offering 7–10% gross yields represent the strongest risk-adjusted opportunity in the near term.
For Homeowners
The forecast supports holding existing property. The combination of falling interest rates and persistent undersupply creates conditions for steady capital appreciation. Remortgaging to lock in lower fixed rates as they become available is the primary tactical consideration.
For First-Time Buyers
The 2026–2027 window represents a relative buying opportunity: affordability is improving (HPER at 4.7x, below the 20-year average), while prices are forecast to accelerate from 2028 onwards. Waiting for further price growth will likely prove more costly than buying now at current interest rates and refinancing later.
For Policymakers
The persistent gap between housing delivery and household formation remains the central challenge. Without addressing local authority capacity, construction sector constraints, and development viability simultaneously, the 1.5 million target will remain aspirational.
Methodology and Sources
| Source | Forecast Type | Coverage |
|---|---|---|
| Savills | House prices, rents (5-year) | UK mainstream & prime |
| JLL | House prices (5-year) | UK & regional |
| Knight Frank | House prices, market outlook | UK & London |
| OBR | House prices, fiscal forecasts | UK national |
| Bank of England | Base rate, mortgage data | UK monetary policy |
| ONS | CPI, earnings, HPI | UK official statistics |
| RICS | Market sentiment, activity | UK survey data |
| DLUHC | Housing supply, planning | England & Wales |
How to Cite This Page
If you are referencing these forecasts in your own content:
UK Property Market Forecast 2026–2030. Shaded Canvas. Published April 2026, updated quarterly. Available at: https://blog.shadedcanvas.co.uk/post/uk-property-market-forecast-2026-2030
Stop being a landlord. Start being an investor.
Shaded Canvas introduces serious capital to vetted UK property opportunities — targeting 12–16% net returns.
Start Investing →