Property transactions are the lifeblood of the UK housing market. Every sale generates tax revenue, professional fees, and economic activity — and the volume of transactions is one of the most reliable leading indicators of market health. This page consolidates every critical transaction statistic for 2026, from HMRC monthly volumes and annual trends to fall-through rates, conveyancing timelines, and the real cost of buying and selling property.
Whether you are a buyer planning your timeline, a property investor analysing market liquidity, or an estate agent benchmarking performance, this is the definitive reference.
Last Updated: April 2026 | Next Update: July 2026
Key Transaction Statistics at a Glance
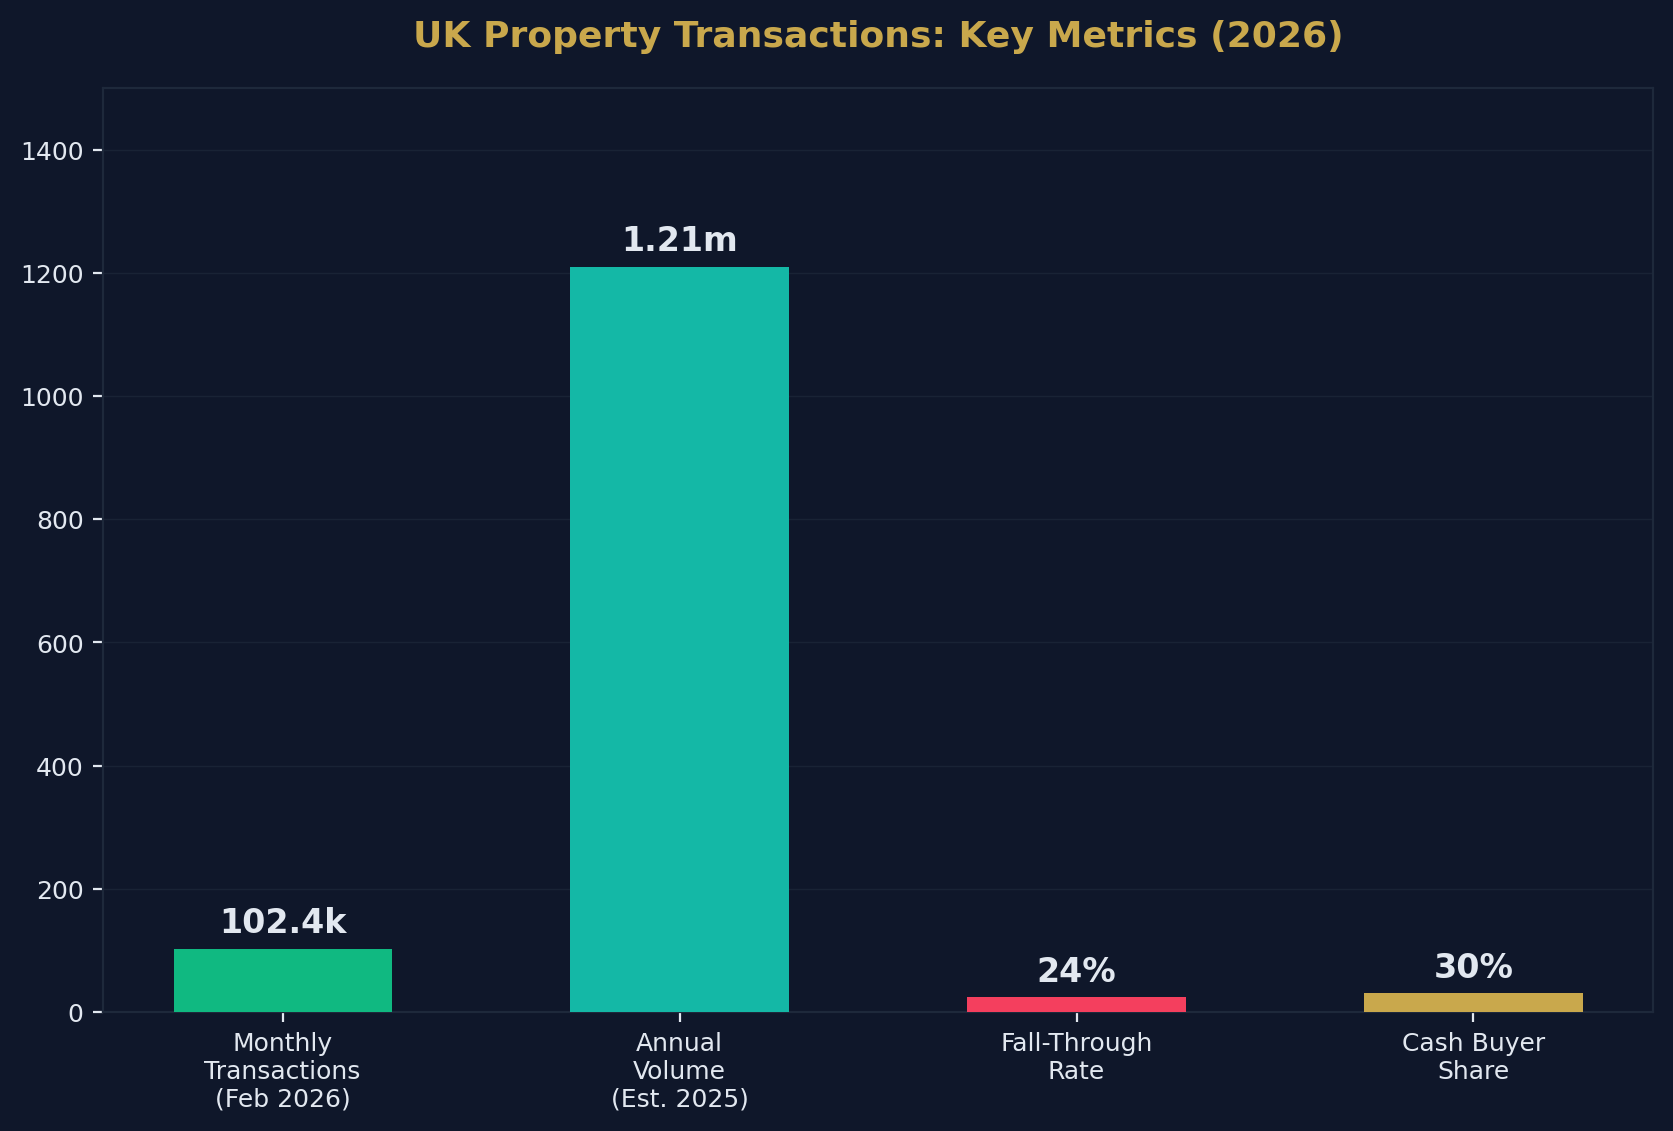
- HMRC recorded 102,410 residential transactions in February 2026 (seasonally adjusted).
- February 2026 transactions were approximately 6% lower than February 2025.
- Annual transaction volumes are running at approximately 1.15–1.20 million completions.
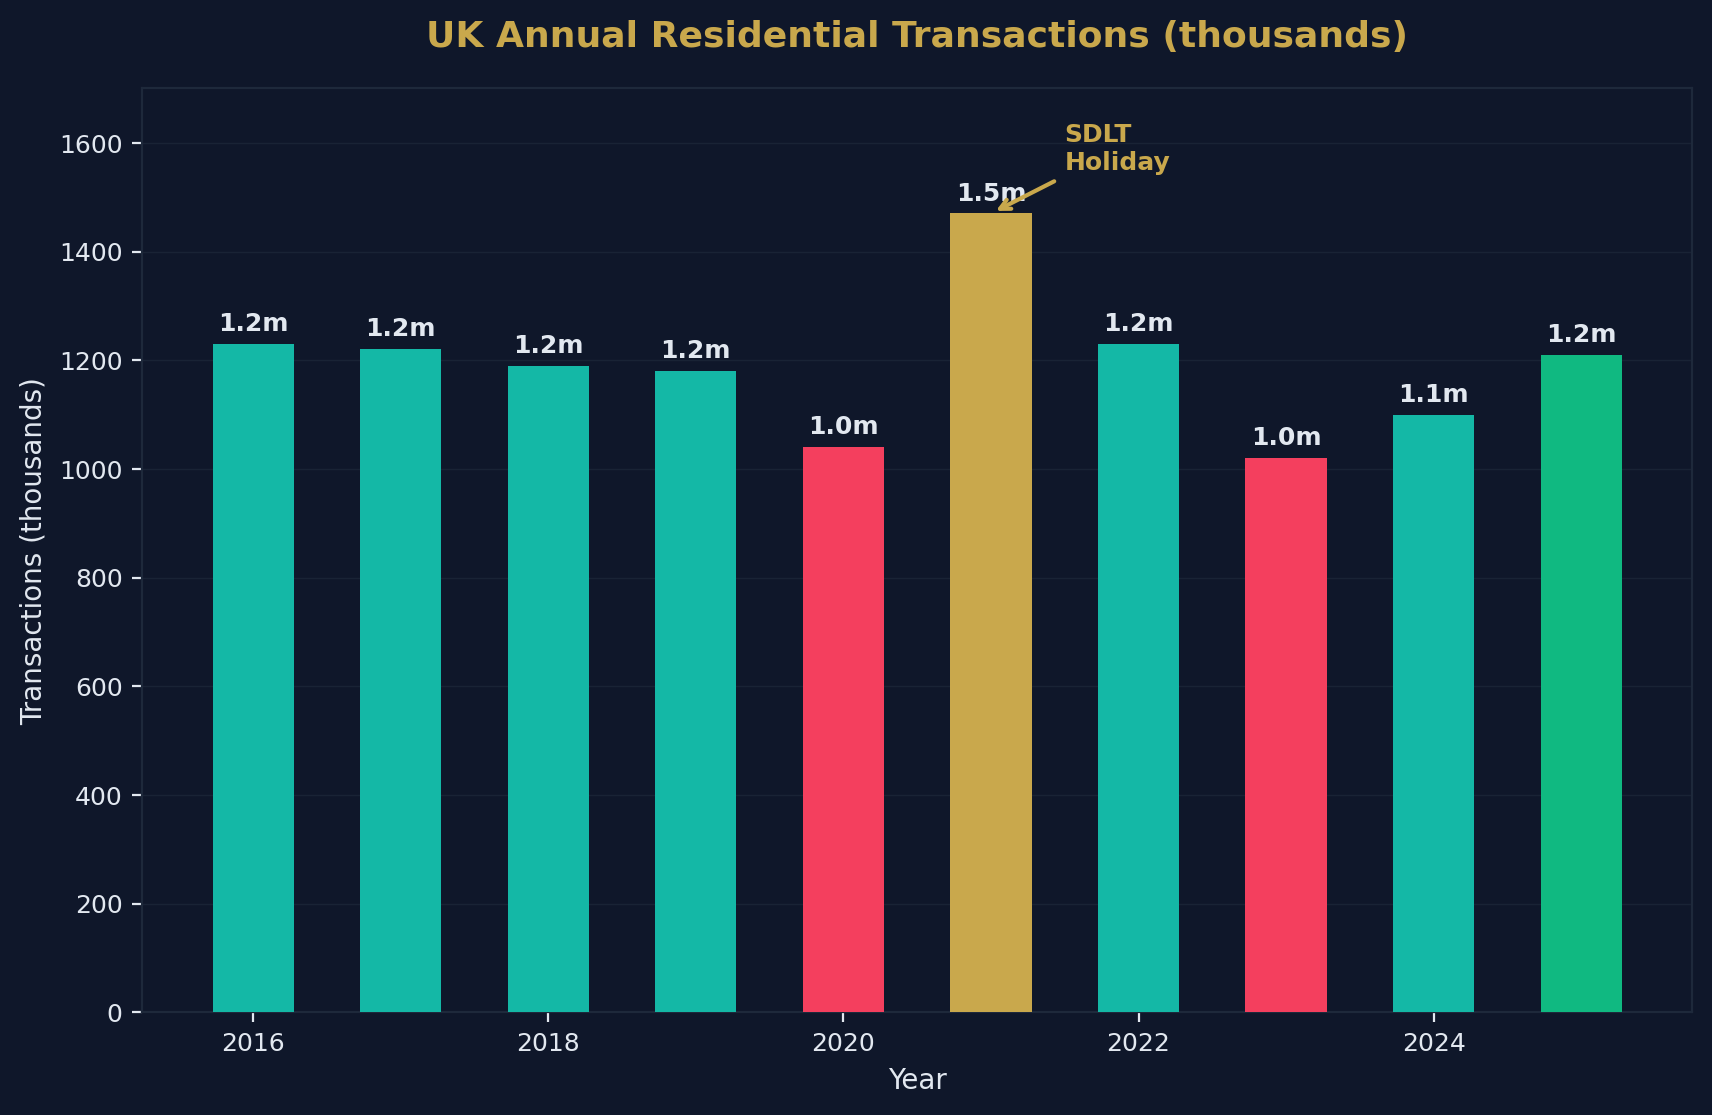
- The 2021 peak of 1.47 million transactions was driven by the stamp duty holiday.
- Approximately 23–24% of agreed sales fall through before completion.
- 46% of buyers in a property chain experience delays or collapsed sales.
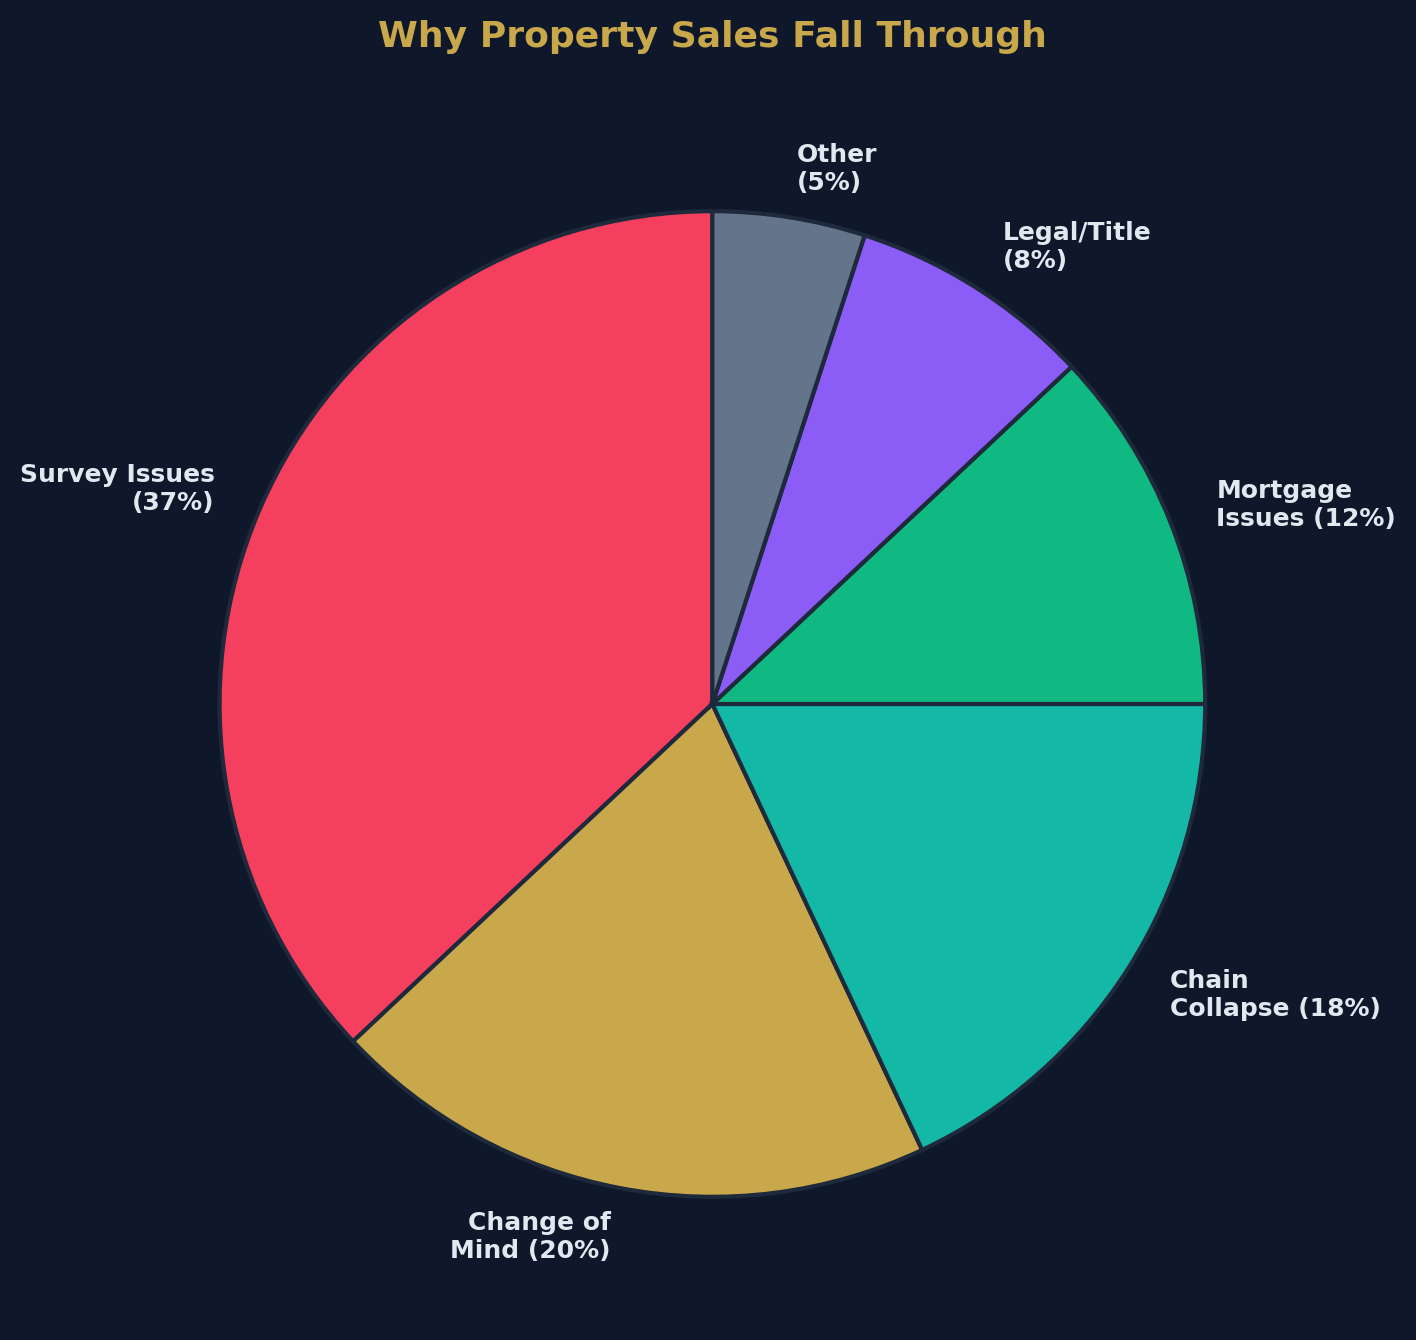
- The leading cause of fall-throughs is survey issues (37% of cases).
- The average time from listing to completion is 5–6 months.
- Conveyancing takes 12–20 weeks on average from offer acceptance.
- First-time buyers account for approximately 30% of all transactions.
- Buy-to-let purchases account for approximately 10% of transactions.
- Cash buyers account for approximately 30% of all purchases.
- SDLT receipts totalled approximately £15.6 billion in 2024/25.
- The average estate agent fee is 1.0–1.5% of the sale price (+ VAT).
Source: Shaded Canvas analysis of HMRC, HM Land Registry, Bank of England, and industry data. Last updated April 2026.
Monthly Transaction Volumes
HMRC Residential Transactions (Seasonally Adjusted)
| Month | Transactions | MoM Change |
|---|---|---|
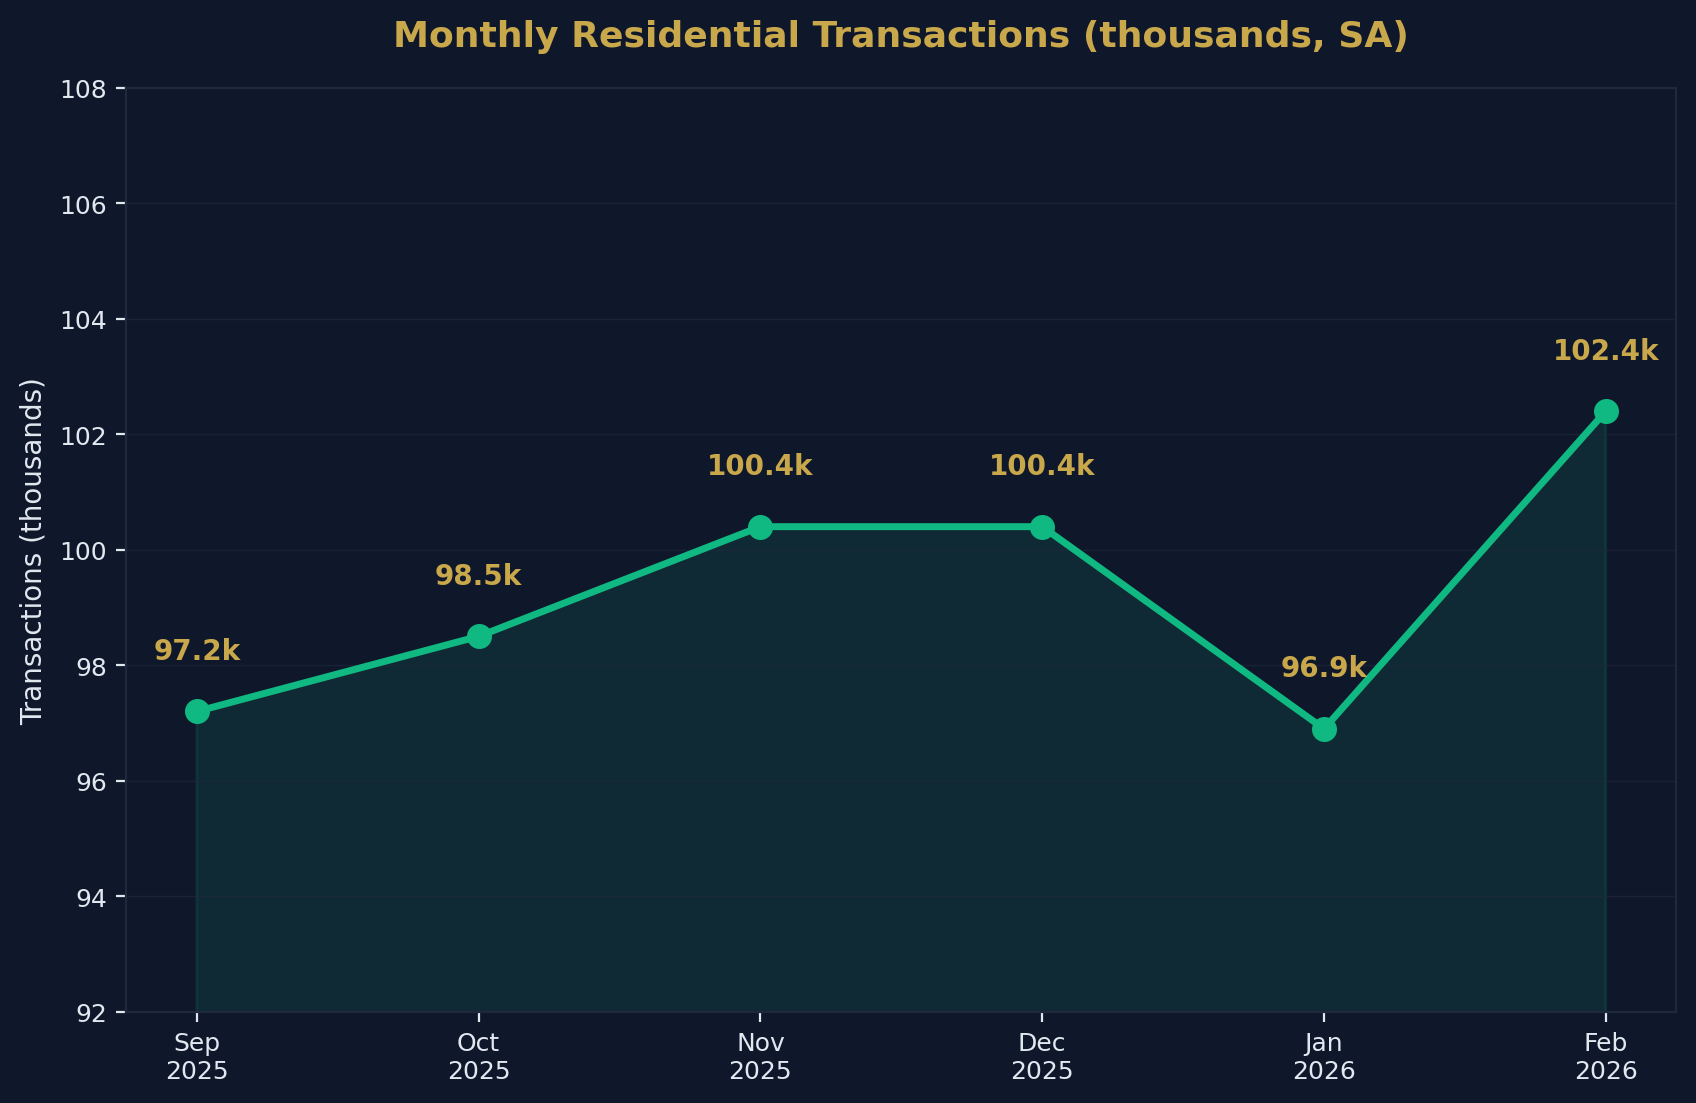
| September 2025 | 97,200 | — |
| October 2025 | 98,450 | +1.3% |
| November 2025 | 100,350 | +1.9% |
| December 2025 | 100,440 | +0.1% |
| January 2026 | 96,940 | -3.5% |
| February 2026 | 102,410 | +5.6% |
Non-Seasonally Adjusted (February 2026)
| Category | Transactions |
|---|---|
| Residential (£40k+) | 87,330 |
| Non-residential | 8,790 |
| Total | 96,120 |
Annual Transaction History
UK Residential Transactions by Year
| Year | Transactions | YoY Change | Context |
|---|---|---|---|
| 2016 | 1,230,000 | — | Post-BTL surcharge rush |
| 2017 | 1,220,000 | -1% | Market normalisation |
| 2018 | 1,190,000 | -2% | Brexit uncertainty |
| 2019 | 1,180,000 | -1% | Pre-COVID baseline |
| 2020 | 1,040,000 | -12% | COVID lockdowns |
| 2021 | 1,470,000 | +41% | Stamp duty holiday |
| 2022 | 1,230,000 | -16% | Mini-budget crisis |
| 2023 | 1,020,000 | -17% | Rate shock |
| 2024 | 1,100,000 | +8% | Recovery begins |
| 2025 | 1,210,000 (est.) | +10% | SDLT deadline rush |
Stamp Duty Deadline Effects
The March 2025 SDLT threshold changes created a predictable rush:
- Q1 2025 transactions surged as buyers raced to beat the deadline
- Q2 2025 saw a corresponding dip as the pipeline emptied
- This "cliff edge" effect mirrors the 2021 stamp duty holiday pattern
Transaction Process: Timelines
Average Time from Listing to Completion
| Stage | Duration |
|---|---|
| Marketing to offer accepted | 4–8 weeks |
| Conveyancing (offer to exchange) | 8–14 weeks |
| Exchange to completion | 1–4 weeks |
| Total | 5–6 months |
What Causes Delays?
| Delay Factor | Frequency | Average Impact |
|---|---|---|
| Property chain complications | Very common | +4–8 weeks |
| Local authority search delays | Common | +2–4 weeks |
| Mortgage offer delays | Common | +2–3 weeks |
| Leasehold management packs | Common (flats) | +3–6 weeks |
| Survey renegotiation | Moderate | +2–4 weeks |
| Title issues | Occasional | +4–12 weeks |
Fall-Through Rates
Why Transactions Collapse
| Reason | % of Fall-Throughs |
|---|---|
| Survey reveals issues | 37% |
| Buyer/seller change of mind | 20% |
| Chain collapse | 18% |
| Mortgage declined/down-valuation | 12% |
| Legal/title complications | 8% |
| Other | 5% |
Fall-Through Statistics
| Metric | Figure |
|---|---|
| Overall fall-through rate | 23–24% |
| Chain-involved transactions | ~70% of all sales |
| Chain participants experiencing delays | 46% |
| Average cost of a failed transaction | £2,700+ per party |
| Transactions that complete first time | ~76% |
The £2,700+ average cost of a failed transaction includes wasted survey fees (£300–600), legal fees (£500–1,500), mortgage arrangement fees (£500–1,000+), and the opportunity cost of lost time.
Transactions by Buyer Type
Market Share by Buyer Category
| Buyer Type | Share of Transactions |
|---|---|
| First-time buyers | ~30% |
| Home movers (existing owners) | ~30% |
| Cash buyers | ~30% |
| Buy-to-let investors | ~10% |
Cash Buyers
Cash buyers now represent approximately 30% of all property transactions — a historically high share. The trend reflects:
- Older downsizers selling mortgage-free properties and buying with equity
- International buyers in <a href="/post/foreign-investment-in-london-real-estate" style="color:#c9a84c;text-decoration:underline;font-weight:500">London and the South East
- Property investors avoiding mortgage costs and stress tests
- Inherited wealth ("Bank of Mum and Dad")
Cash transactions complete significantly faster (8–12 weeks vs 5–6 months) and have a much lower fall-through rate (~10% vs 24%). That speed and certainty premium is one reason investors increasingly use property sourcing services to secure off-market deals they can complete on quickly.
Cost of Buying and Selling Property
Typical Buyer Costs
| Cost | Amount |
|---|---|
| Stamp duty (£300k property, FTB) | £0 (below £300k threshold) |
| Stamp duty (£300k property, home mover) | £2,500 |
| Stamp duty (£300k, BTL/2nd home) | £17,500 (incl. 5% surcharge) |
| Conveyancing solicitor | £800–£1,500 |
| Survey (Level 2 HomeBuyer) | £400–£600 |
| Survey (Level 3 Building) | £600–£1,200 |
| Mortgage arrangement fee | £500–£2,000 |
| Valuation fee | Often free with lender |
| Land Registry fee | £95–£540 |
| Total buyer costs (excl. deposit) | £3,000–£8,000+ |
Typical Seller Costs
| Cost | Amount |
|---|---|
| Estate agent fee (1.0–1.5% + VAT) | £3,000–£5,400 (on £300k) |
| Conveyancing solicitor | £600–£1,200 |
| EPC certificate | £60–£120 |
| Early mortgage repayment charge | £0–£5,000+ |
| Removal costs | £500–£2,000 |
| Total seller costs | £4,000–£14,000+ |
Tax Revenue from Property Transactions
HMRC Property Tax Receipts
| Tax | Revenue (2024/25) |
|---|---|
| Stamp Duty Land Tax | ~£15.6 billion |
| Capital Gains Tax (property) | ~£4.5 billion |
| Inheritance Tax (property element) | ~£3.5 billion |
| Council Tax (total) | ~£42 billion |
| Income Tax (rental income) | ~£6.5 billion |
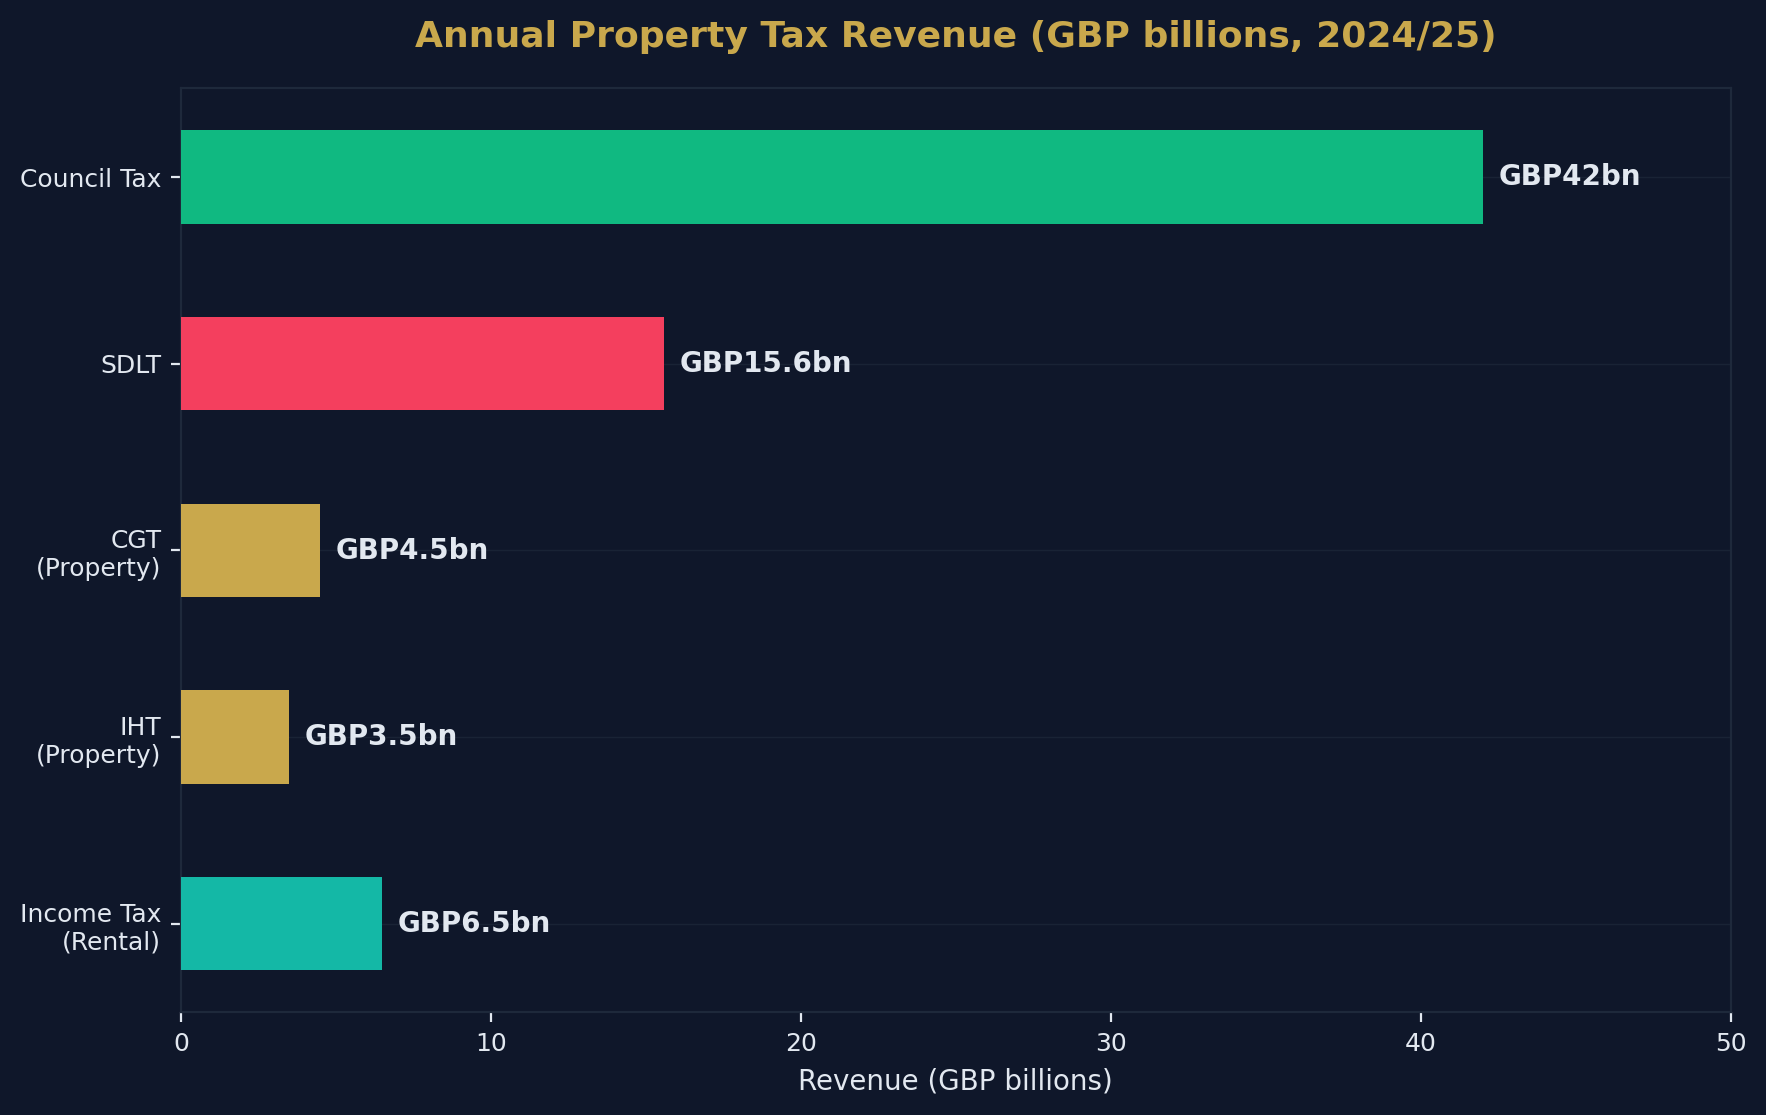
Property-related taxes generate approximately £70+ billion per year for the Exchequer — making the housing market one of the single largest sources of government revenue.
Regional Transaction Activity
Transactions per 1,000 Households (2025, Approximate)
| Region | Rate |
|---|---|
| South West | ~38 |
| East Midlands | ~36 |
| Yorkshire & Humber | ~35 |
| North West | ~34 |
| West Midlands | ~33 |
| South East | ~32 |
| East of England | ~31 |
| North East | ~30 |
| London | ~22 |
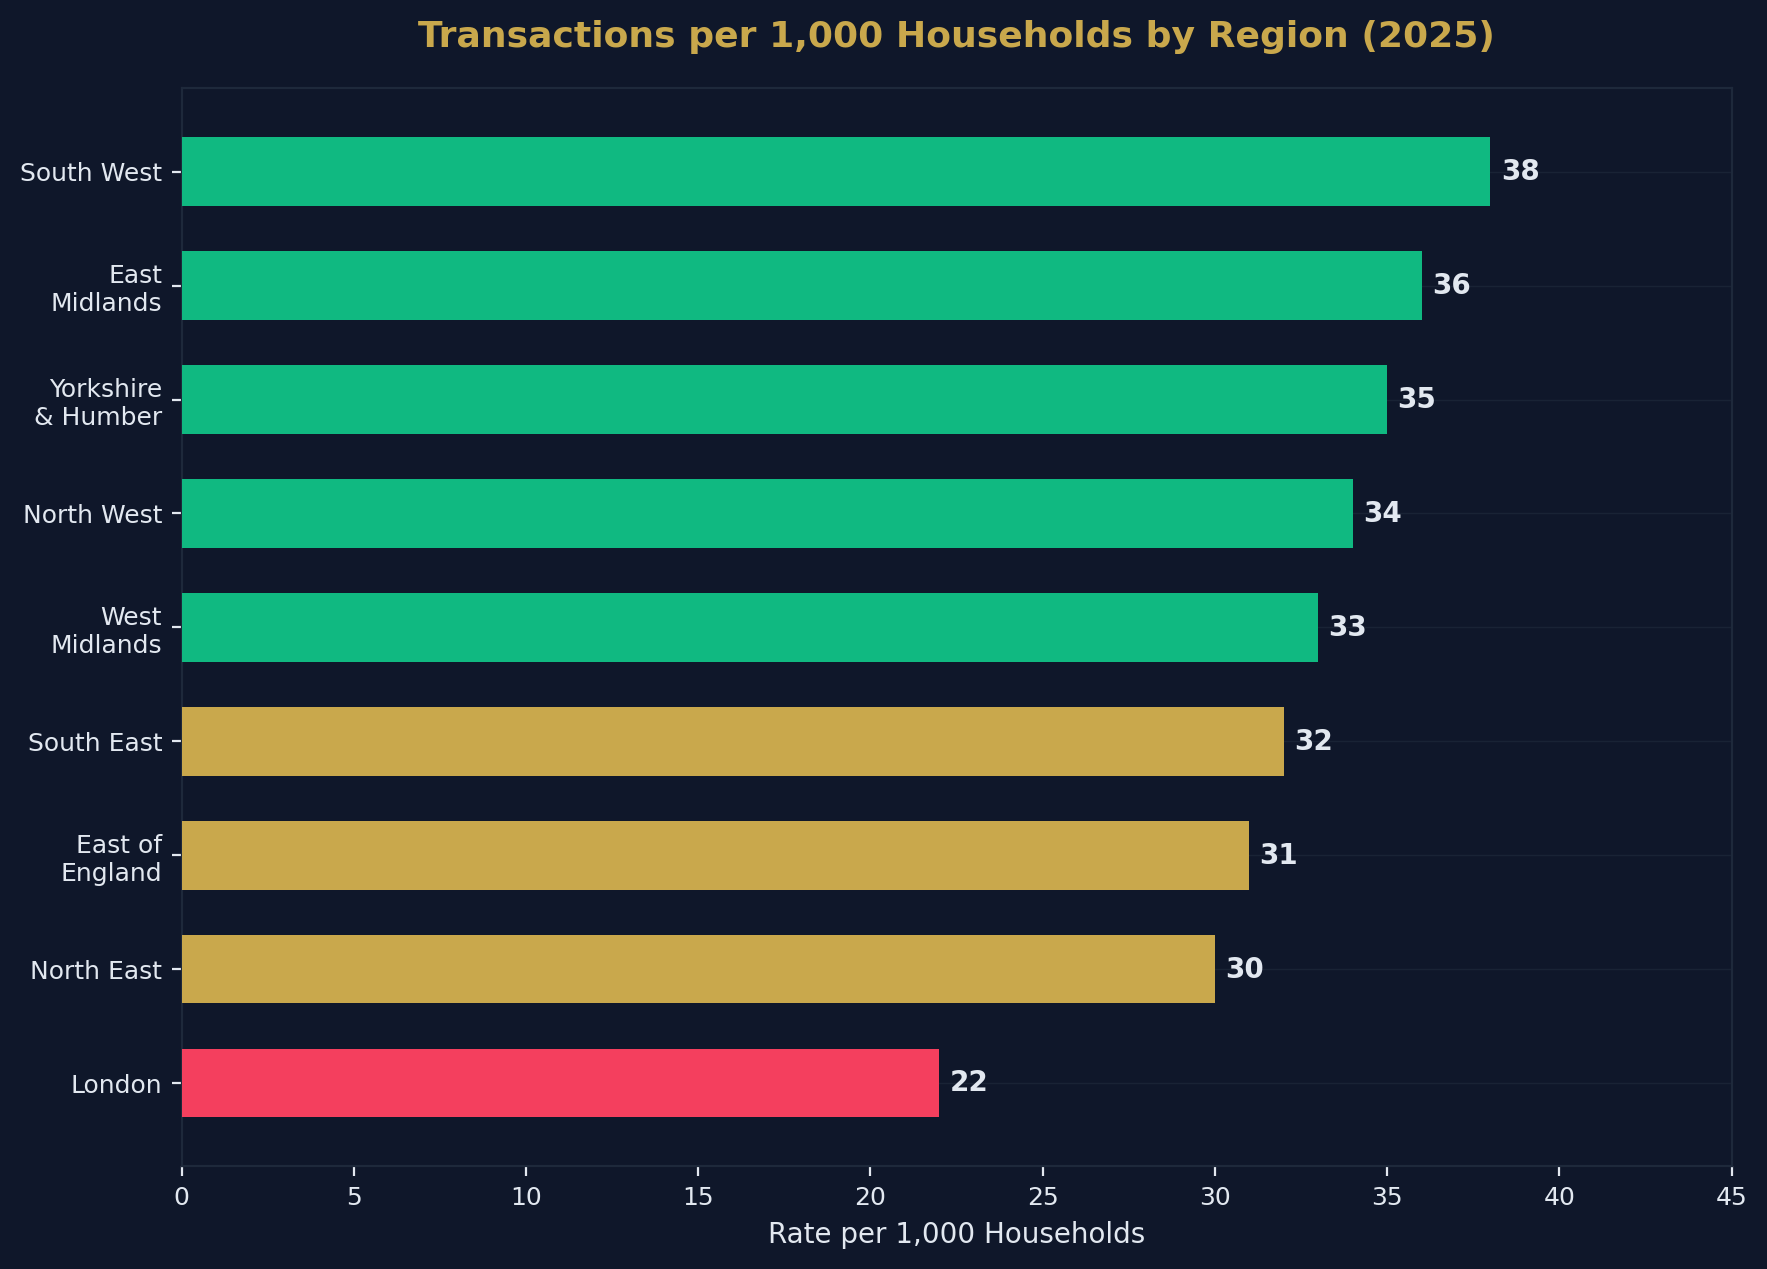
London's significantly lower transaction rate reflects its affordability constraints, higher stamp duty burden, and longer average holding periods.
Methodology and Data Sources
| Source | Data Type | Coverage |
|---|---|---|
| HMRC | Monthly transactions, SDLT receipts | UK |
| HM Land Registry | Price paid, completions | England & Wales |
| Bank of England | Mortgage approvals | UK |
| TwentyCi/GetAgent | Fall-through rates | England & Wales |
| ONS | Household data | UK |
How to Cite This Page
UK Property Transaction Statistics 2026. Shaded Canvas. Published April 2026, updated quarterly. Available at: https://blog.shadedcanvas.co.uk/post/uk-property-transaction-statistics-2026
Stop being a landlord. Start being an investor.
Shaded Canvas introduces serious capital to vetted UK property opportunities — targeting 12–16% net returns.
Start Investing →