The UK property market remains one of the most data-rich investment environments in the world. Whether you are a seasoned portfolio landlord, a first-time buyer researching affordability, or a journalist citing housing trends, this page consolidates the most critical property and investment statistics for 2026 — sourced directly from the ONS, HM Land Registry, Bank of England, HMRC, and leading industry analysts.
This is a living document, updated quarterly as new data is released.
Last Updated: April 2026 | Next Update: July 2026
50 Key UK Property Statistics at a Glance
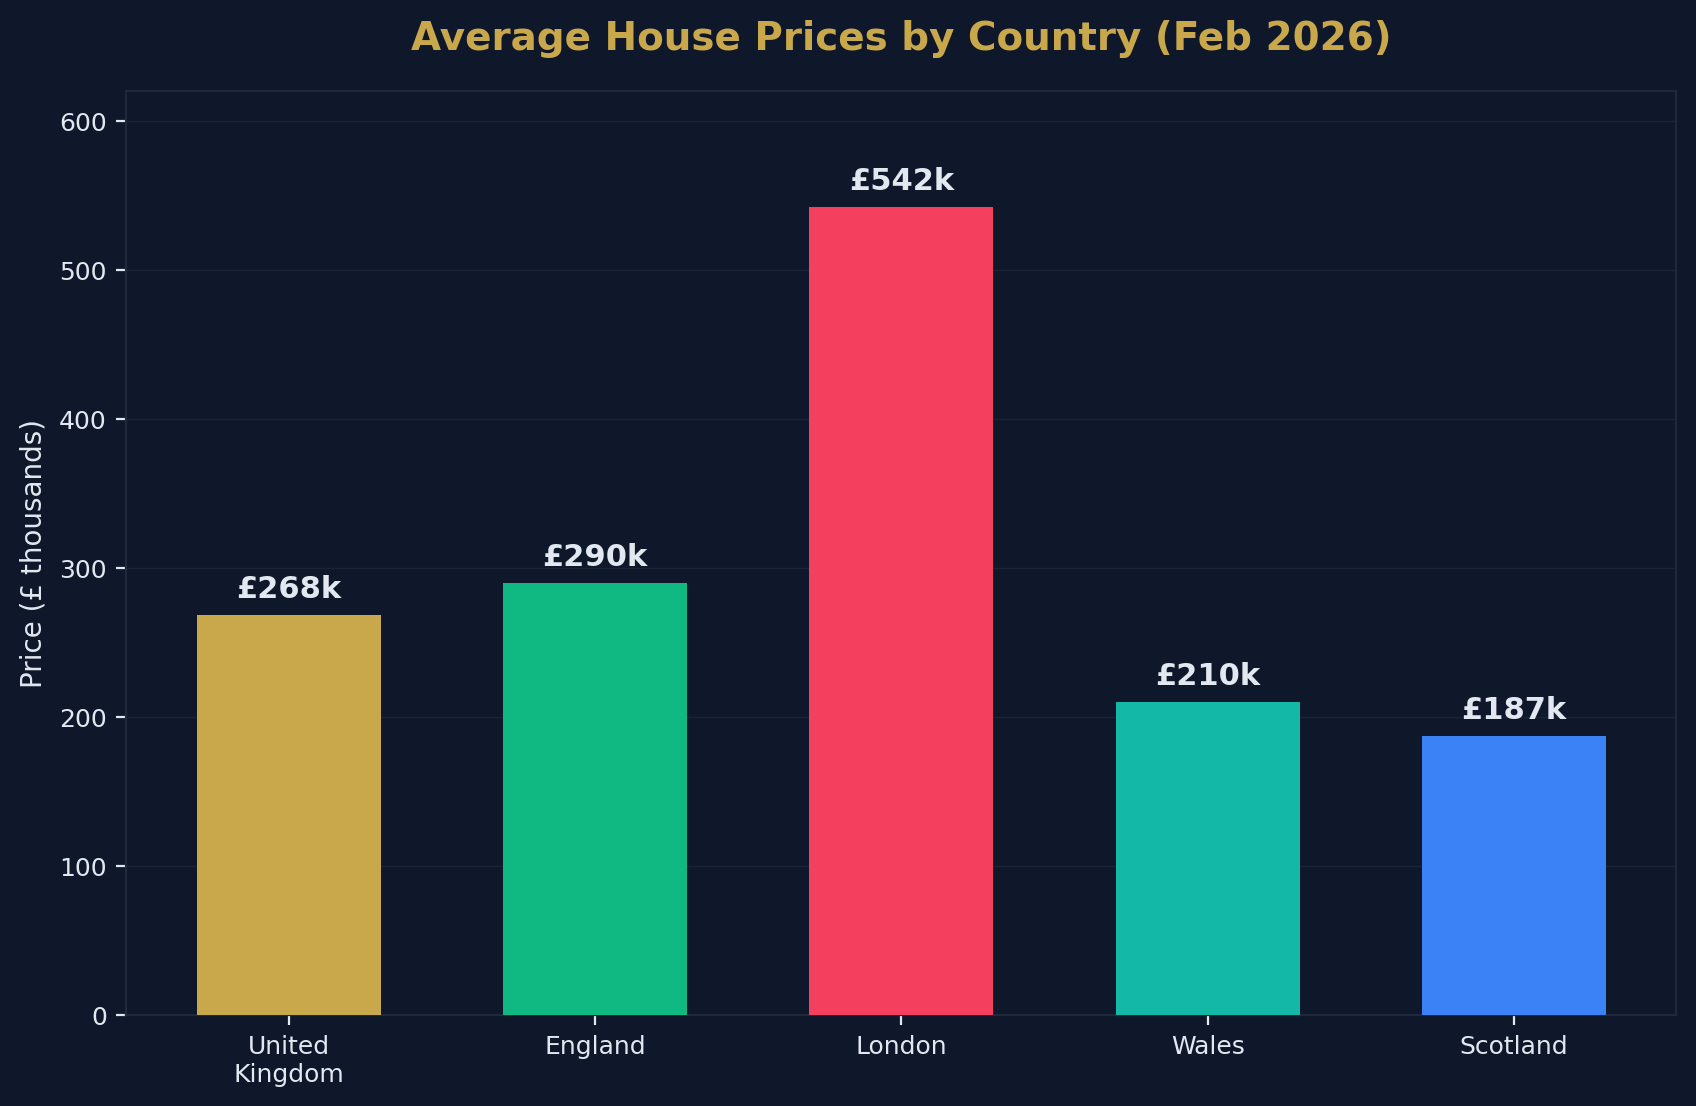
- The average UK house price is £268,000 (February 2026, ONS).
- UK house prices rose 1.2% year-on-year to February 2026.
- The average house price in England is £290,000.
- The average house price in Wales is £210,000 (+2.5% annual growth).
- The average house price in Scotland is £187,000 (+2.3% annual growth).
- London's average house price is £542,000, but prices fell 3.3% year-on-year.
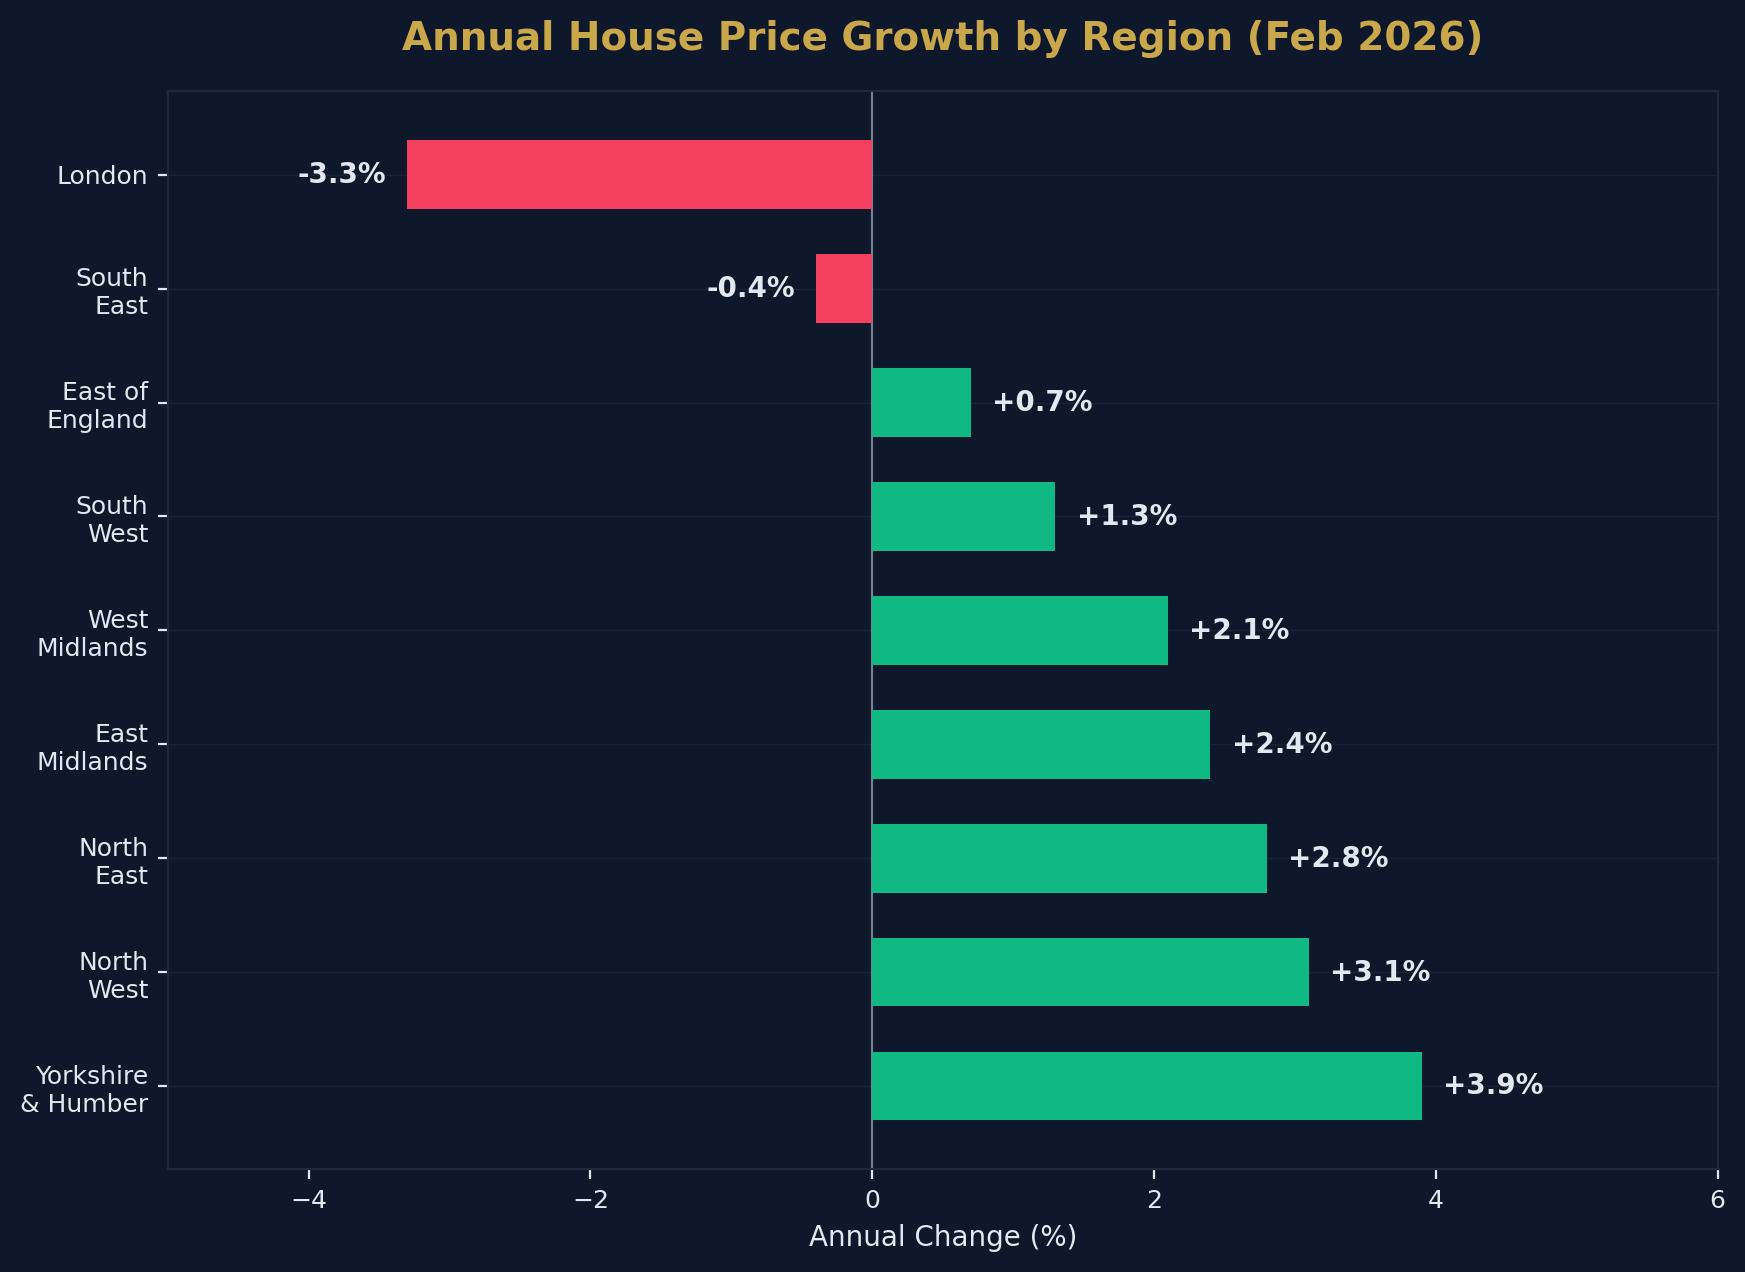
- Yorkshire and the Humber recorded the highest regional growth at +3.9%.
- The average UK monthly private rent is £1,377 (March 2026, ONS).
- UK private rents increased 3.4% in the 12 months to March 2026 — the lowest rate since March 2022.
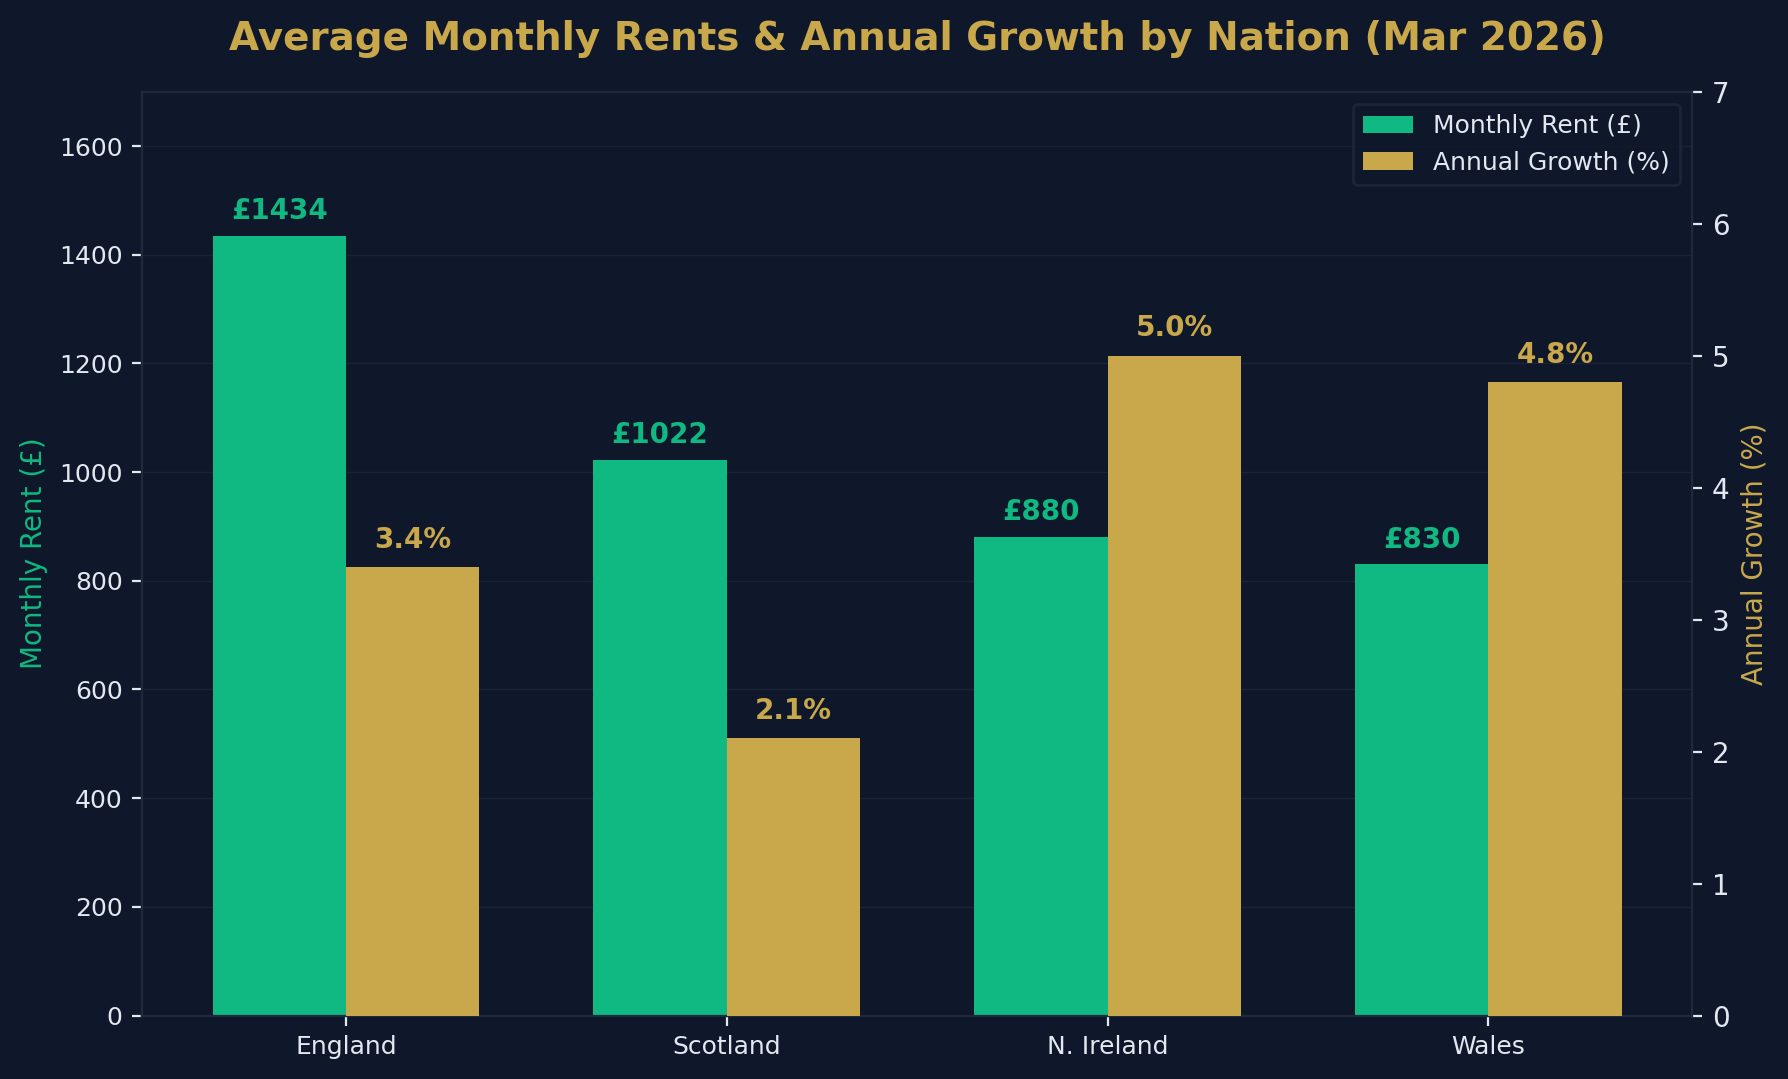
- The average monthly rent in England is £1,434.
- The average monthly rent in Wales is £830 (+4.8%).
- The average monthly rent in Scotland is £1,022 (+2.1%).
- Northern Ireland rents average £880 (+5.0%).
- The North East recorded the highest rental inflation in England at 6.5%.
- London recorded the lowest rental inflation at 1.7%.
- Kensington and Chelsea has the UK's highest average rent at £3,599/month.
- Dumfries and Galloway has the UK's lowest average rent at £554/month.
- Average gross rental yields across the UK sit between 5.5% and 6.0%.
- Top-yielding cities (Newcastle, Leeds, Hull, Liverpool, Bradford, Nottingham) deliver 7–10%+ gross yields.
- There are approximately 4.7 million privately rented households in the UK.
- Over 443,000 active buy-to-let companies are registered in the UK.
- Approximately 75–80% of new BTL purchases are now made through limited companies.
- The average BTL mortgage rate (2-year fix, 75% LTV) is approximately 3.73%.
- The Bank of England base rate is 3.75% (April 2026).
- Net mortgage approvals for house purchases reached 62,600 in February 2026.
- Remortgaging approvals rose to 41,200 in February 2026.
- The effective interest rate on newly drawn mortgages is 4.10%.
- Average advertised 2-year and 5-year fixed rates are trending back toward 5%.
- UK residential property transactions totalled 102,410 in February 2026 (seasonally adjusted).
- Transaction volumes were 6% higher than January 2026 but 6% lower than February 2025.
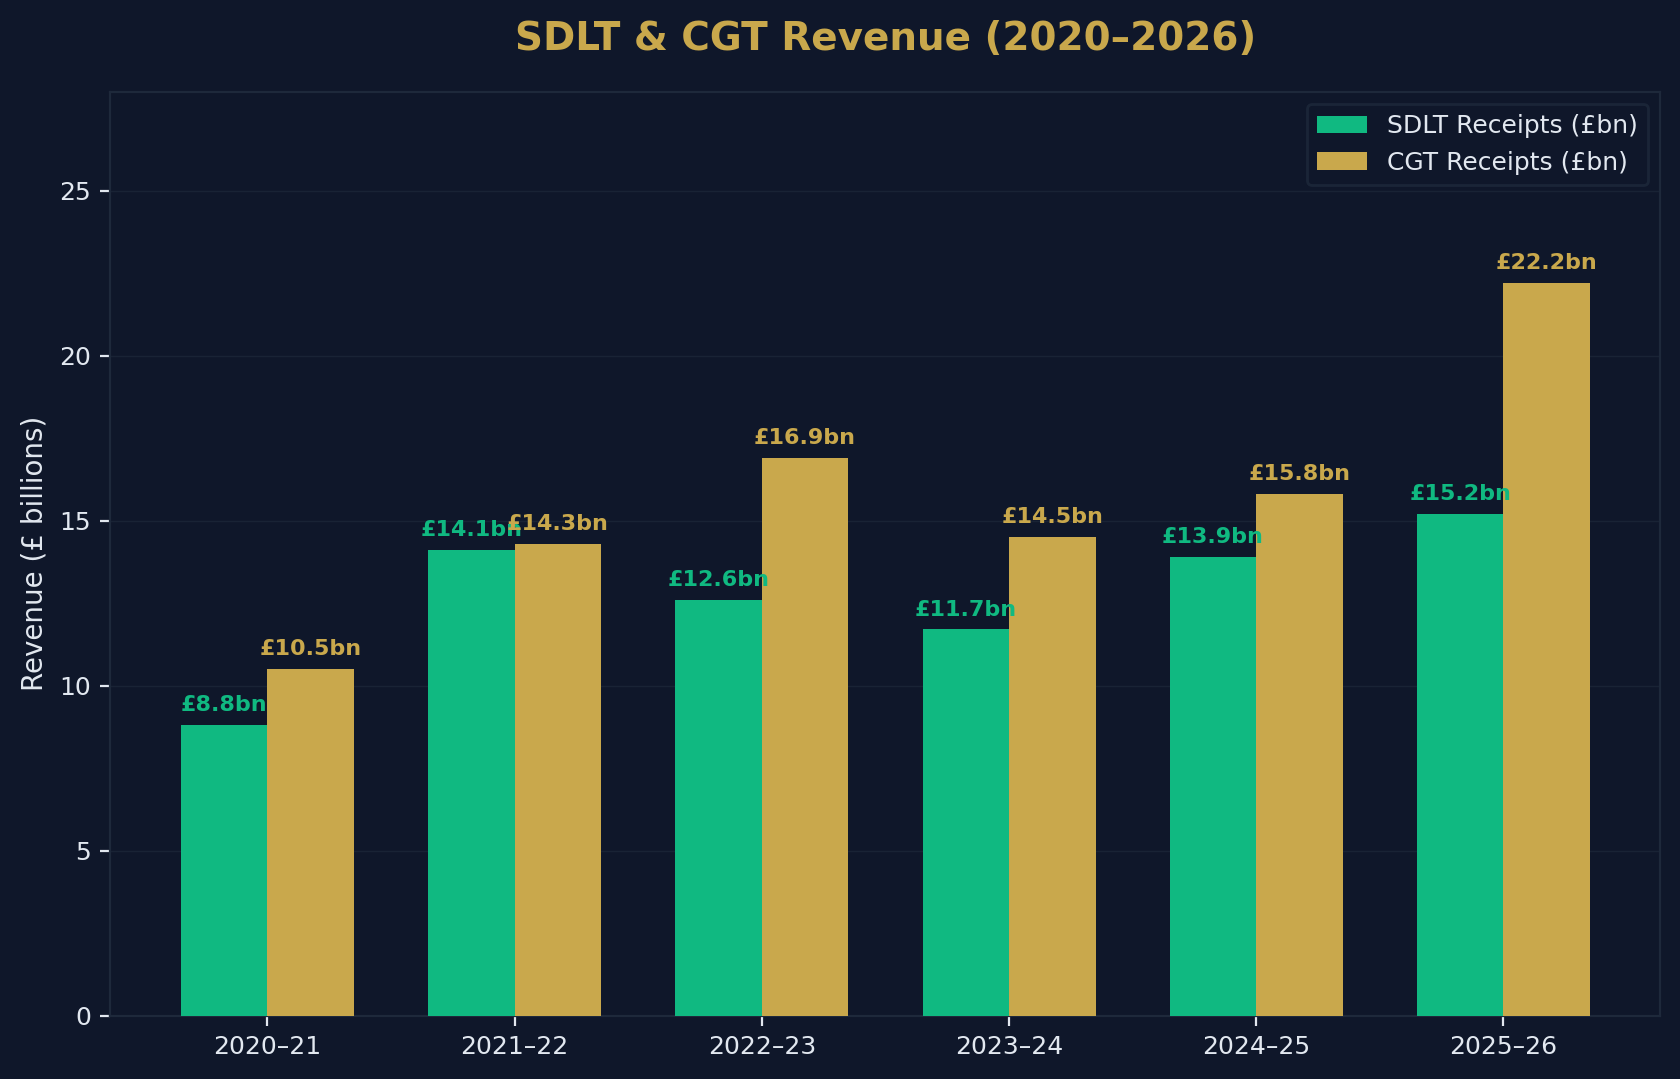
- HMRC collected £15.2 billion in Stamp Duty Land Tax during 2025–26.
- SDLT receipts increased 9.2% year-on-year, driven by the nil-rate threshold reduction.
- Capital Gains Tax receipts reached a record £22.2 billion in 2025–26.
- The CGT annual exemption has been reduced to £3,000 (since April 2024).
- The OBR forecasts total property taxes will reach £28 billion by 2030.
- The average age of a UK first-time buyer is 33.9 years.
- The average FTB house price is £226,000.
- The average FTB deposit ranges from £50,000 to £61,000 nationally (London: £120,000+).
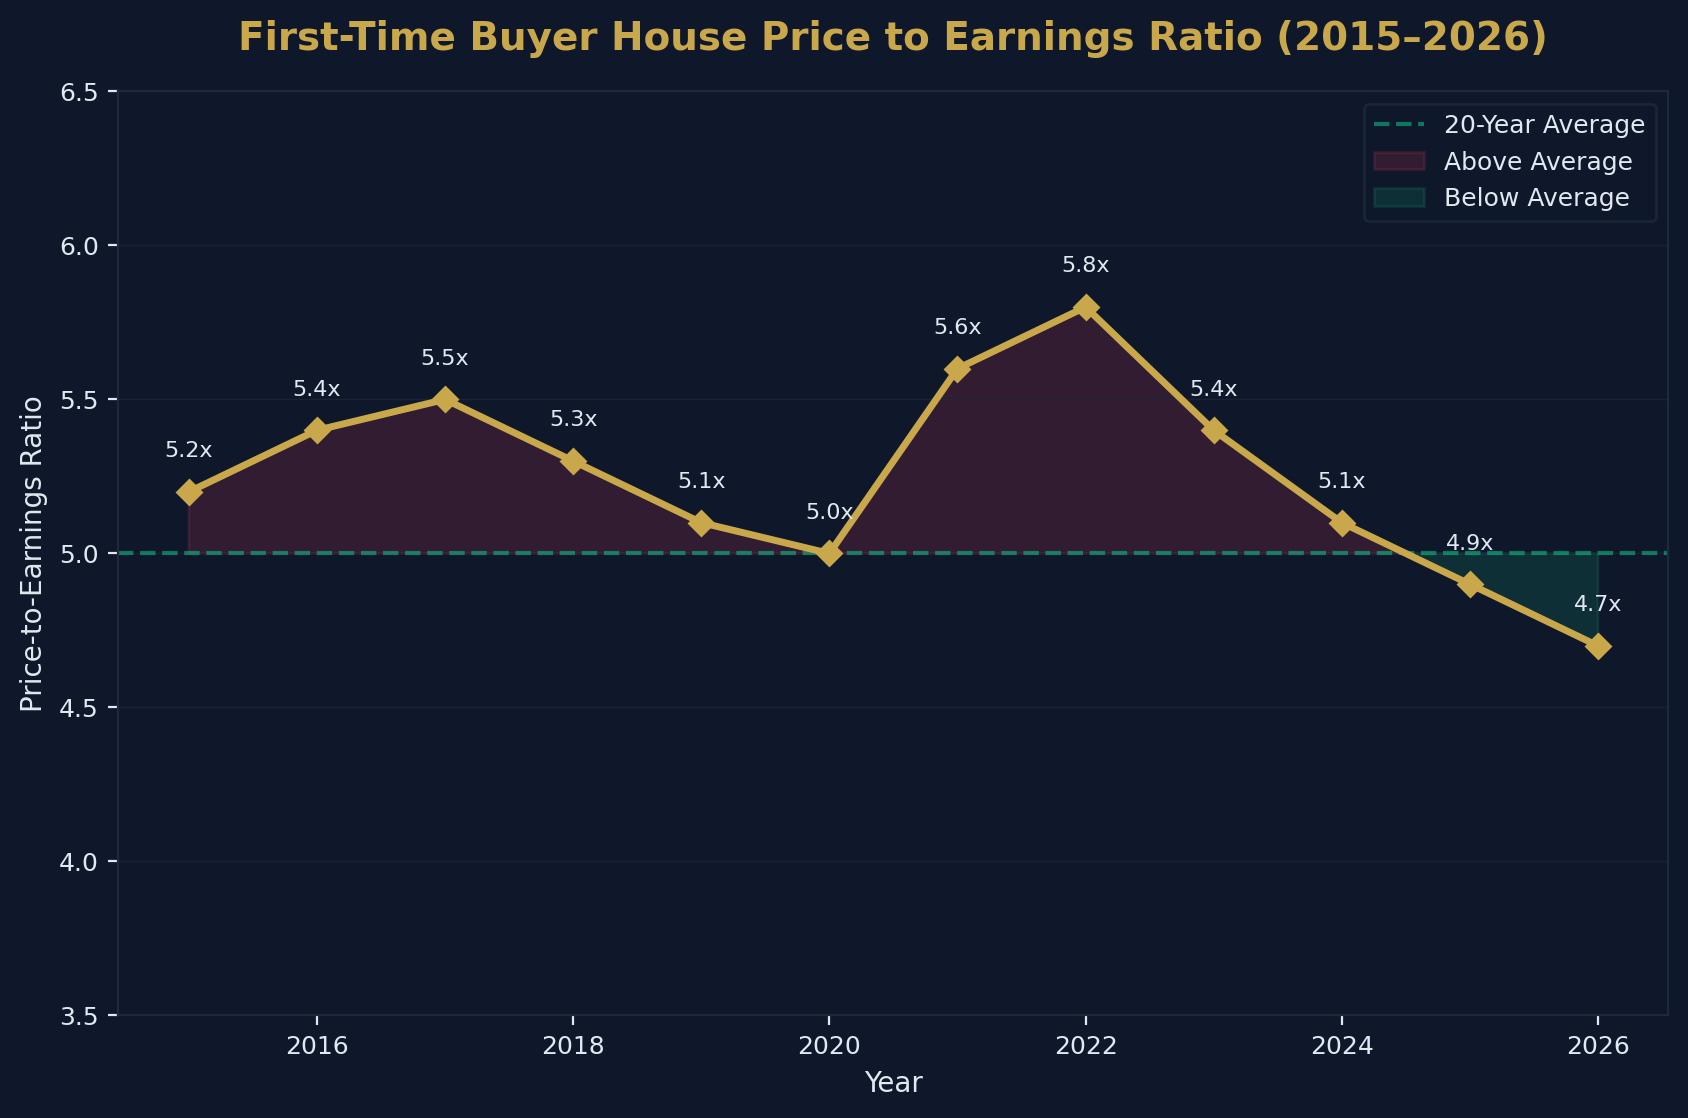
- The first-time buyer house price-to-earnings ratio is 4.7, below its 20-year average.
- Housing affordability improved in 70% of UK local authority areas over the past year.
- Approximately 202,568 homes in England and Wales are registered to overseas owners.
- 33.9% of overseas-owned properties are in London.
- Hong Kong investors hold 13.8% of all overseas-registered UK homes, followed by Singapore (7.9%) and the USA (6.8%).
- Non-UK residents pay a 2% SDLT surcharge on top of standard rates.
- There are approximately 497,000 HMO properties in England.
- HMO licence applications increased 40% since 2018, with 57,000 applications in the past year alone.
- The UK average gross HMO yield is approximately 8.4%.
- Over 70 councils operate additional HMO licensing schemes.
- Savills forecasts 22.2% cumulative house price growth by 2030 (peak year: 2029 at +5.5%).
- The OBR projects a cumulative house price increase of 16.4% by 2030–31.
Source: Shaded Canvas analysis of ONS, HM Land Registry, Bank of England, HMRC, RICS, UK Finance, and Savills data. Last updated April 2026. Cite as: "UK Property Investment Statistics 2026, Shaded Canvas (blog.shadedcanvas.co.uk)."
UK House Prices: Regional Breakdown
The UK House Price Index (UK HPI) — published jointly by the ONS, Land Registry, Registers of Scotland, and Land & Property Services Northern Ireland — is the gold standard for measuring residential property values. The February 2026 release reveals a market defined by stark regional divergence.
National Overview
| Country | Average Price | Annual Change |
|---|---|---|
| United Kingdom | £268,000 | +1.2% |
| England | £290,000 | +0.8% |
| Wales | £210,000 | +2.5% |
| Scotland | £187,000 | +2.3% |
National headline growth of 1.2% masks the reality that different regions are experiencing fundamentally different markets. Wales and Scotland continue to outperform England, where the average is dragged down by London's correction.
Regional Performance (England)
| Region | Annual Growth | Direction |
|---|---|---|
| Yorkshire and the Humber | +3.9% | ▲ Strongest |
| North West | +3.1% | ▲ |
| North East | +2.8% | ▲ |
| East Midlands | +2.4% | ▲ |
| West Midlands | +2.1% | ▲ |
| South West | +1.3% | → |
| East of England | +0.7% | → |
| South East | -0.4% | ▼ |
| London | -3.3% | ▼ Weakest |
The data reveals a clear North–South inversion. Yorkshire's 3.9% annual growth dwarfs London's 3.3% decline. This pattern has persisted for three consecutive quarters and reflects structural affordability constraints in the South East, combined with strong rental demand driving capital values in northern cities.
London's average price of £542,000 remains roughly double the national average, but the premium is narrowing. For investors, this creates a dual opportunity: northern cities offer higher yields and capital growth momentum, while London's correction may present a long-term entry point for those with sufficient capital.
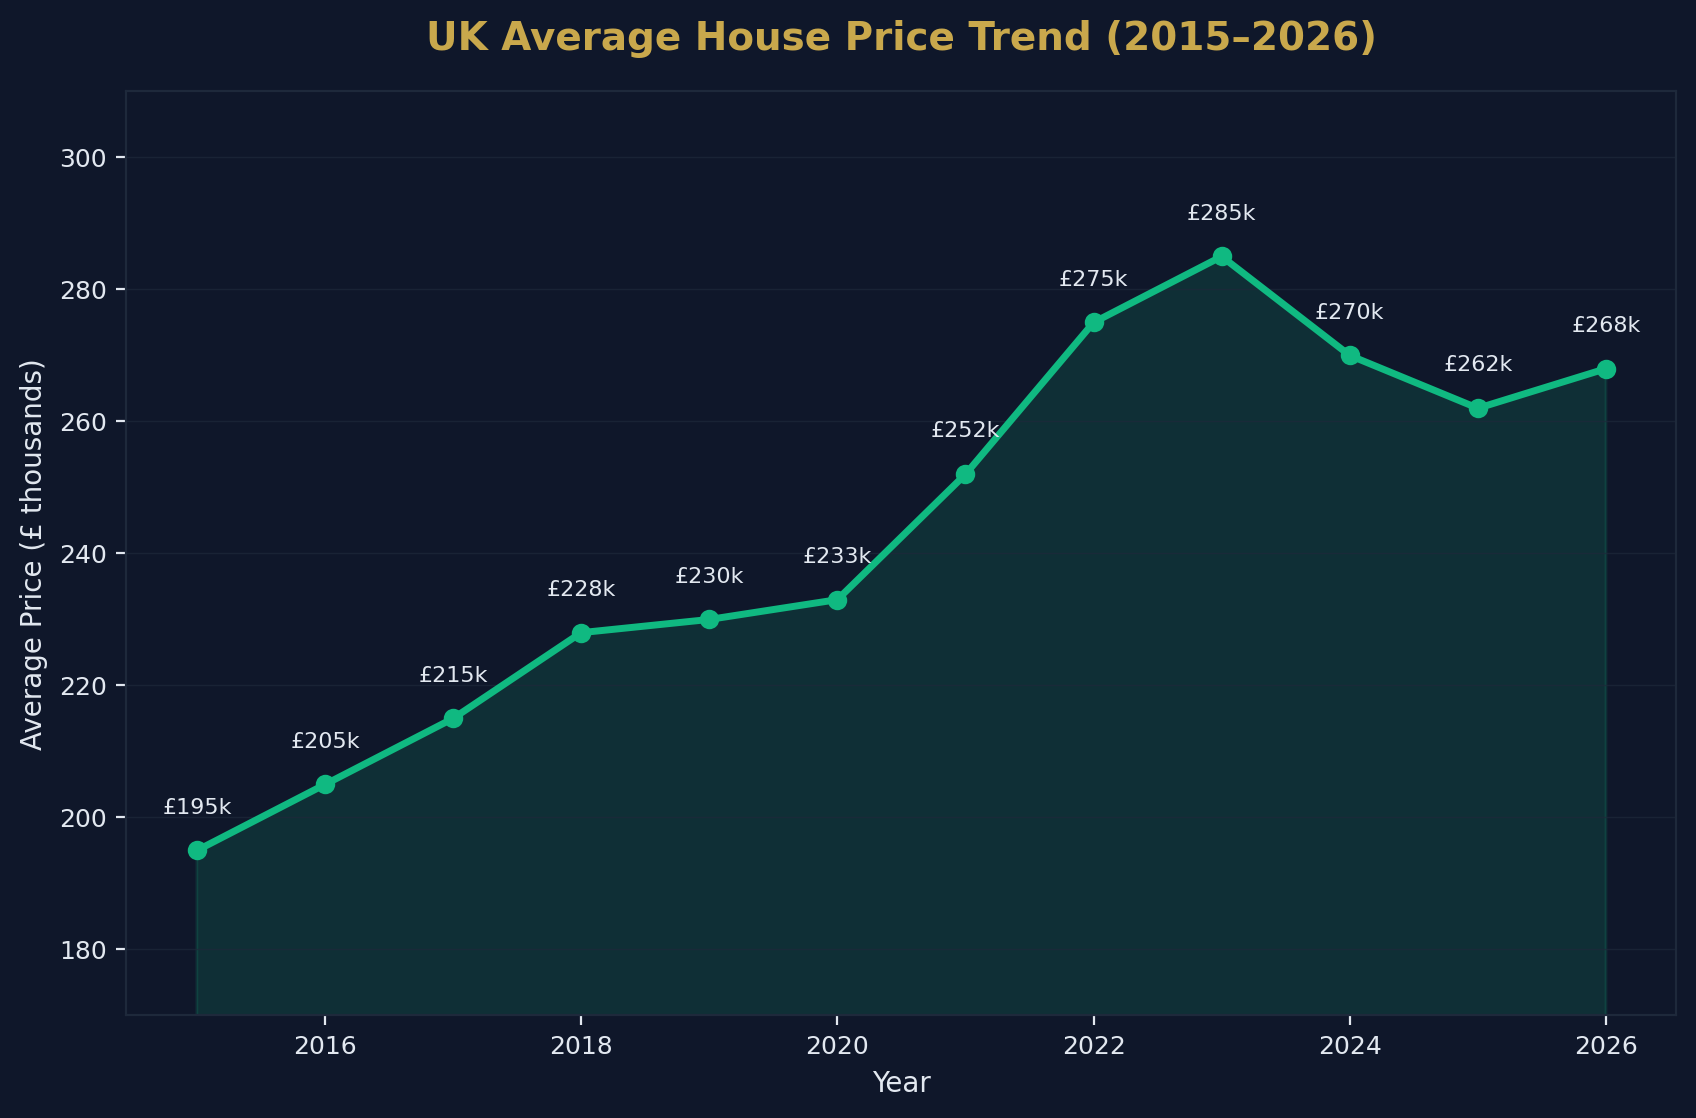
House Price Trend (2015–2026)
Between 2015 and 2026, the UK average house price has increased from approximately £195,000 to £268,000 — a total gain of 37.4%. However, this growth has been far from linear. The market experienced pandemic-driven spikes in 2021 (+10.2% annual growth), followed by a sharp correction in 2023 (−1.4%) as interest rates surged. The current 1.2% growth rate represents a return to more sustainable, inflation-adjacent appreciation.
UK Rental Market: Yields and Rent Data
Private rents are a critical indicator for investors. The ONS Index of Private Housing Rental Prices, released on 22 April 2026, provides the most authoritative snapshot of the rental market.
Average Monthly Rents by Nation
| Nation | Average Rent (March 2026) | Annual Change |
|---|---|---|
| England | £1,434 | +3.4% |
| Wales | £830 | +4.8% |
| Scotland | £1,022 | +2.1% |
| Northern Ireland | £880 | +5.0% |
| UK Average | £1,377 | +3.4% |
The UK's 3.4% annual rental inflation is the lowest since March 2022, signalling a gradual cooling after three years of exceptional growth that peaked at over 9% in late 2023. The deceleration is most pronounced in London (1.7%), where rents have approached a ceiling relative to tenant incomes.
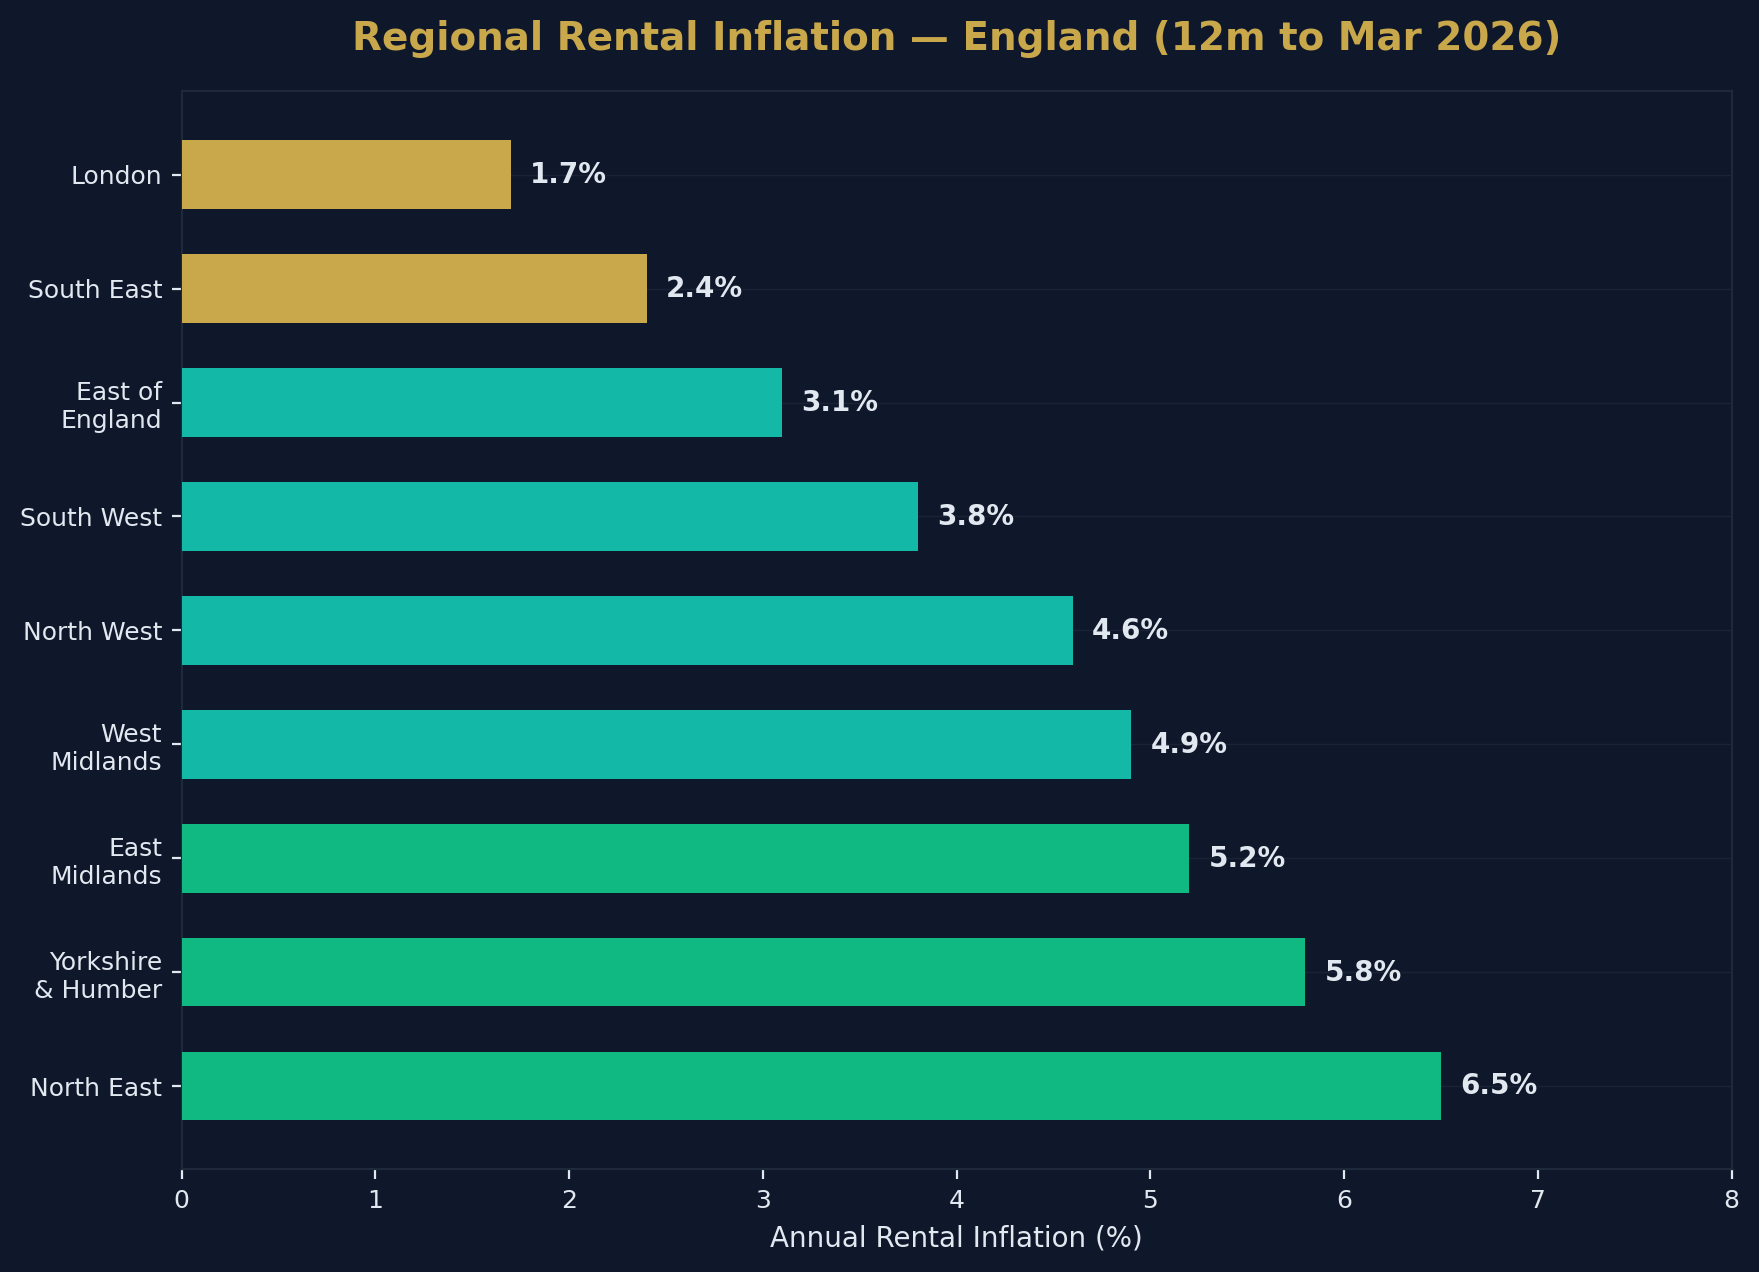
Regional Rental Inflation (England)
| Region | Annual Rental Inflation |
|---|---|
| North East | 6.5% |
| Yorkshire and the Humber | 5.8% |
| East Midlands | 5.2% |
| West Midlands | 4.9% |
| North West | 4.6% |
| South West | 3.8% |
| East of England | 3.1% |
| South East | 2.4% |
| London | 1.7% |
The North East's 6.5% rental inflation is nearly four times London's 1.7% rate, reflecting supply–demand imbalances in northern cities where tenant demand has surged without corresponding housing stock increases.
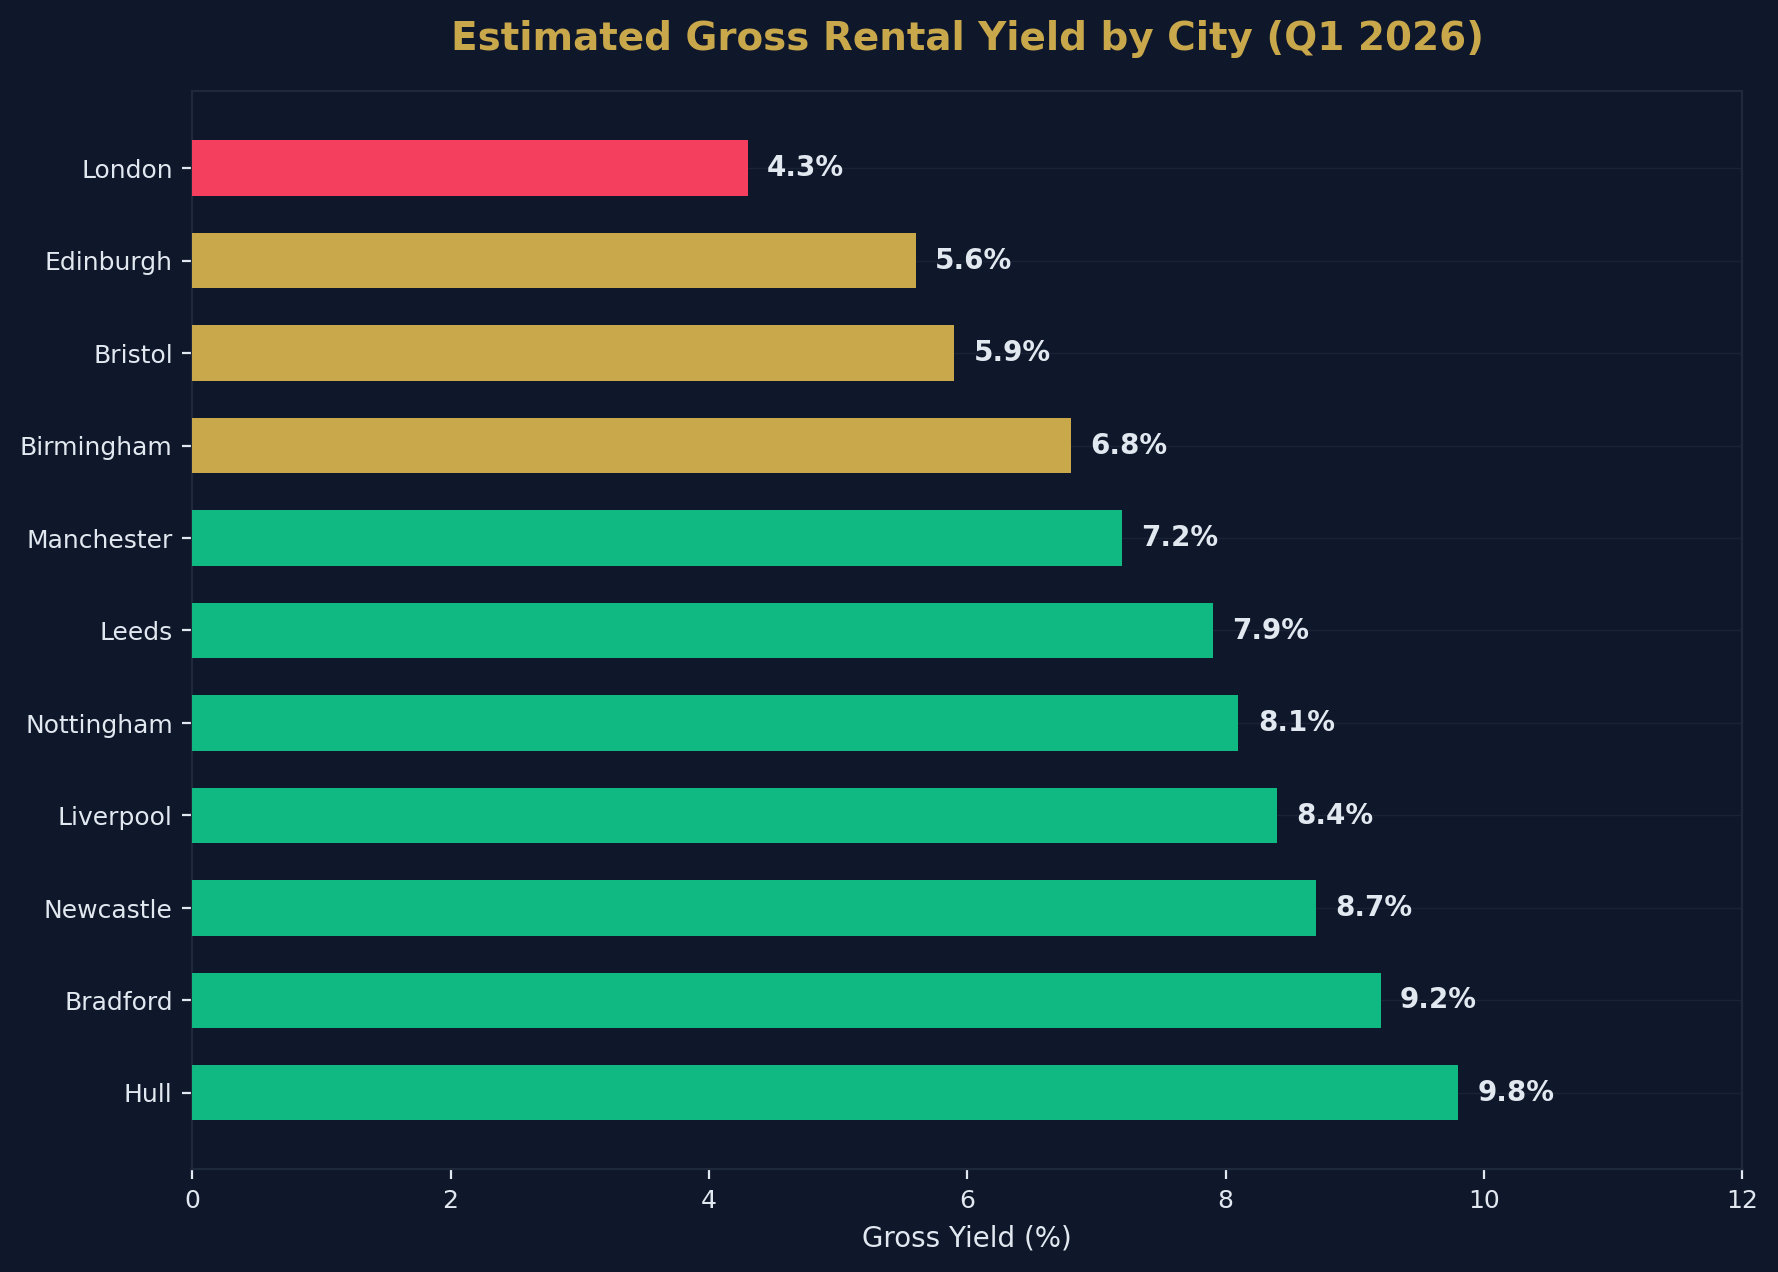
Rental Yield by City
Gross rental yields vary dramatically across the UK. The following estimates are drawn from market analysis of Q1 2026 data:
| City | Estimated Gross Yield |
|---|---|
| Hull | 9.8% |
| Bradford | 9.2% |
| Newcastle | 8.7% |
| Liverpool | 8.4% |
| Nottingham | 8.1% |
| Leeds | 7.9% |
| <a href="/post/investment-property-manchester-uk" style="color:#c9a84c;text-decoration:underline;font-weight:500">Manchester | 7.2% |
| Birmingham | 6.8% |
| Bristol | 5.9% |
| <a href="/post/property-investment-edinburgh" style="color:#c9a84c;text-decoration:underline;font-weight:500">Edinburgh | 5.6% |
| London | 4.3% |
Northern cities dominate the yield tables. Hull's 9.8% gross yield — driven by an average property price of approximately £110,000 against achievable monthly rents of £900 — is more than double London's 4.3%. However, investors must factor in net yield adjustments for void periods, maintenance, management fees, and licensing costs. A gross yield of 9.8% may translate to a net yield of 6–7% after expenses.
Rent Extremes
- Highest average rent: Kensington and Chelsea, London — £3,599/month
- Highest average rent outside London: Oxford — £1,952/month
- Lowest average rent: Dumfries and Galloway, Scotland — £554/month
Buy-to-Let Market Overview
The UK's buy-to-let market has undergone a structural transformation since the introduction of Section 24 mortgage interest relief restrictions in 2017. The data tells the story of a sector that has professionalised, corporatised, and consolidated.
Market Snapshot
| Metric | Figure | Source |
|---|---|---|
| Private rented households | 4.7 million | English Housing Survey |
| Active BTL companies | 443,000+ | Companies House |
| New BTL purchases via limited company | 75–80% | UK Finance |
| Average BTL mortgage rate (2yr fix, 75% LTV) | 3.73% | Moneyfacts |
| Portfolio landlord threshold | 4+ mortgaged properties | PRA |
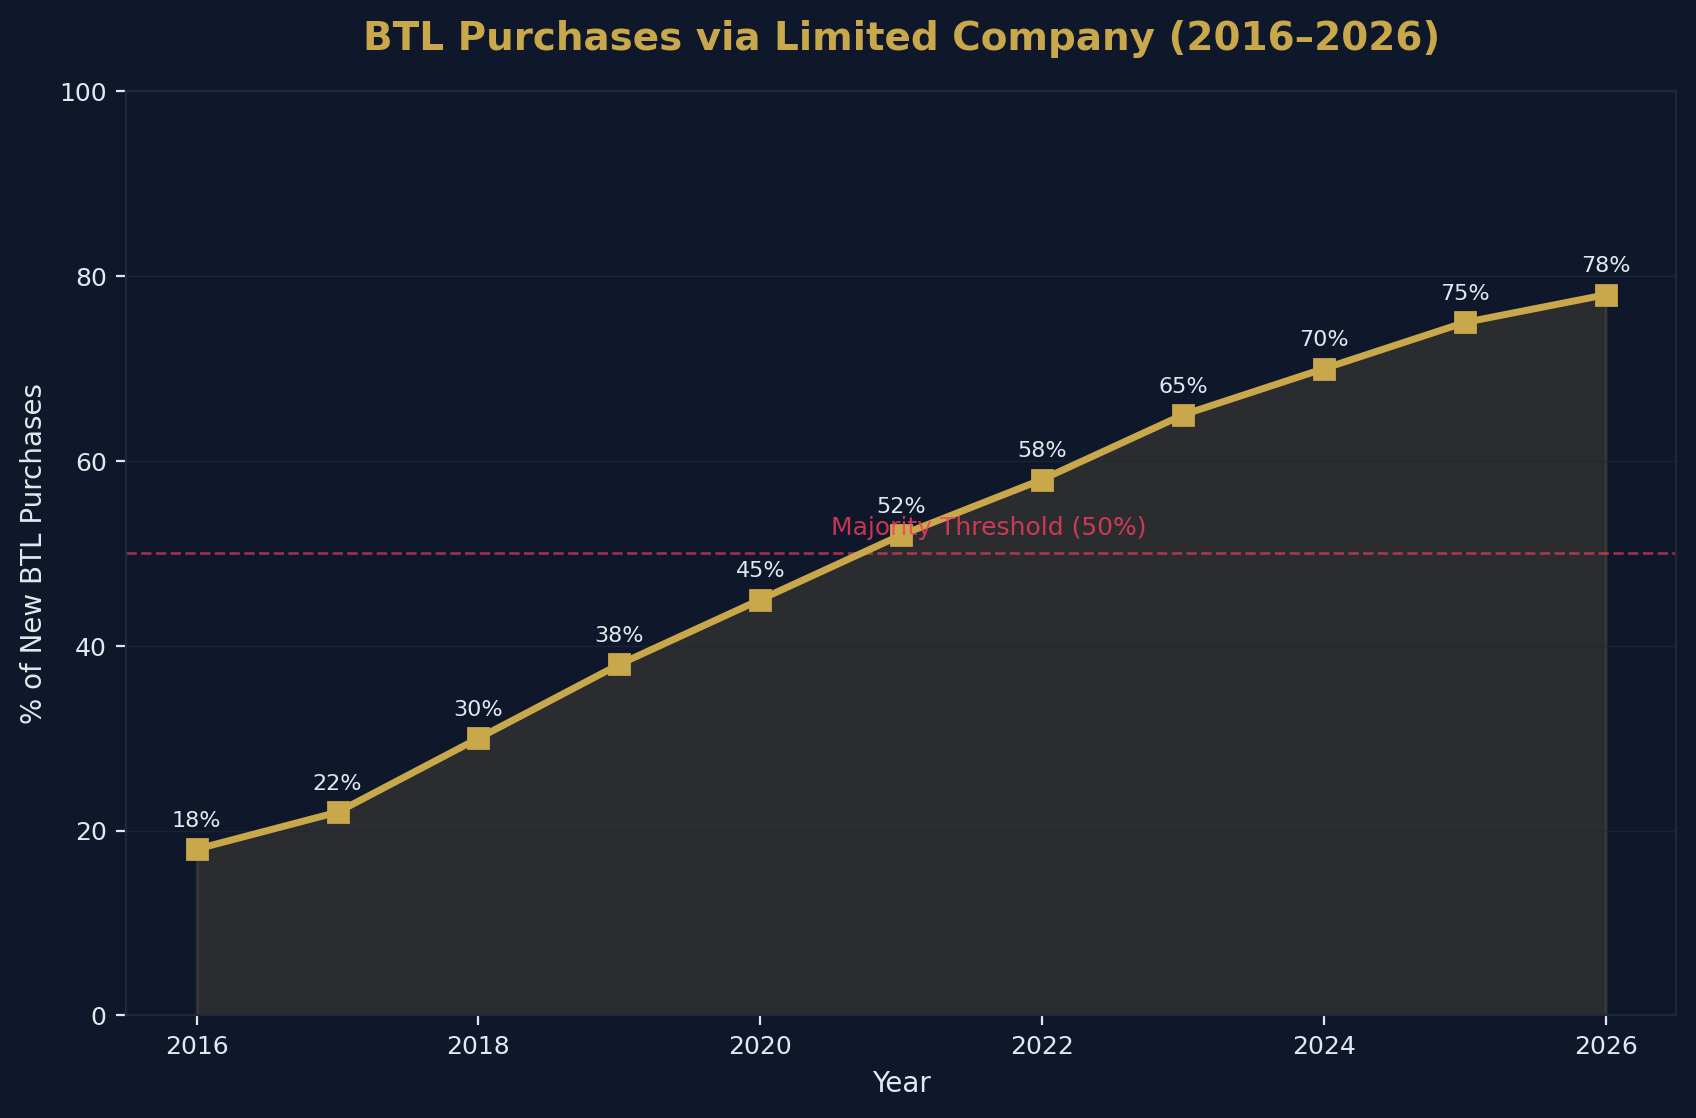
The Incorporation Trend
The shift toward limited company ownership is the defining trend of the 2020s BTL market. In 2016, before Section 24 began phasing in, fewer than 20% of new BTL purchases were made through companies. By 2026, that figure has reached 75–80%.
The tax arithmetic is straightforward. A higher-rate taxpayer holding property personally faces a marginal tax rate of 40% on rental income, with mortgage interest relief restricted to a 20% basic-rate credit. The same investor holding through a limited company pays corporation tax at 25% on profits, with full mortgage interest deductibility.
For a property generating £1,500/month rent with £800/month mortgage interest, the annual tax saving from incorporation can exceed £2,000 — compounding significantly across a multi-property portfolio.
Lending Dynamics
BTL mortgage lending has stabilised after the volatility of 2022–2024. Net mortgage approvals for house purchases reached 62,600 in February 2026, up from 60,200 in January. The market is functioning, but lender stress tests remain stringent.
Portfolio landlords — defined as borrowers with four or more mortgaged BTL properties — face more rigorous assessments. Lenders evaluate the sustainability of the entire portfolio, including aggregate rental income, interest rate resilience, and exposure to concentration risk.
First-Time Buyer Affordability
First-time buyers are the barometer of housing accessibility in the UK. The latest data shows cautious improvement, but structural barriers persist.
Key Metrics
| Metric | Figure |
|---|---|
| Average age of FTB | 33.9 years |
| Average FTB house price | £226,000 |
| Average FTB deposit (national) | £50,000–£61,000 |
| Average FTB deposit (London) | £120,000+ |
| House price-to-earnings ratio | 4.7x |
| Local authorities where affordability improved | 70% |
Affordability Trends
The first-time buyer house price-to-earnings ratio (HPER) of 4.7 has dipped below its 20-year average for the first time since 2020. This improvement has been driven almost entirely by wage growth outpacing house price appreciation, rather than by any reduction in property values.
However, the ratio varies enormously by region. In the most affordable areas — Inverclyde (Scotland), Burnley, and Hartlepool — the HPER sits below 3.5. In central London boroughs, it exceeds 12.0.
The deposit barrier remains the most significant obstacle. Even with 95% LTV products available, the average FTB deposit of £50,000–£61,000 represents multiple years of savings for the average household. In London, where the average deposit exceeds £120,000, parental assistance or inheritance windfalls have become almost essential for market entry.
Property Transactions and Market Activity
HMRC's monthly property transaction data provides the clearest picture of market activity levels.
Transaction Volumes
| Period | Residential Transactions (SA) | Change |
|---|---|---|
| February 2026 | 102,410 | +6% MoM |
| January 2026 | 96,600 | — |
| February 2025 | 108,900 | — |
| October 2025 | 98,450 | — |
February 2026's figure of 102,410 transactions represents a 6% month-on-month increase but remains 6% below February 2025 levels. The year-on-year comparison is distorted by the pre-SDLT-change rush in early 2025, when buyers accelerated purchases ahead of the April 2025 threshold reduction.
Stripping out the SDLT effect, the underlying trend suggests a market transacting at approximately 100,000 units per month — broadly in line with pre-pandemic norms of 95,000–105,000 monthly completions.
Mortgage Approvals
The Bank of England's mortgage approval data provides a forward-looking indicator of transaction activity:
| Month | House Purchase Approvals | Remortgaging Approvals |
|---|---|---|
| February 2026 | 62,600 | 41,200 |
| January 2026 | 60,200 | 38,500 |
| September 2025 | 65,944 | — |
The uplift in remortgaging activity (41,200 in February, up from 38,500 in January) reflects borrowers coming off fixed-rate deals entered during the 2020–2021 low-rate period and refinancing at higher rates. This dynamic will persist throughout 2026 as approximately 1.6 million fixed-rate mortgages are due to expire.
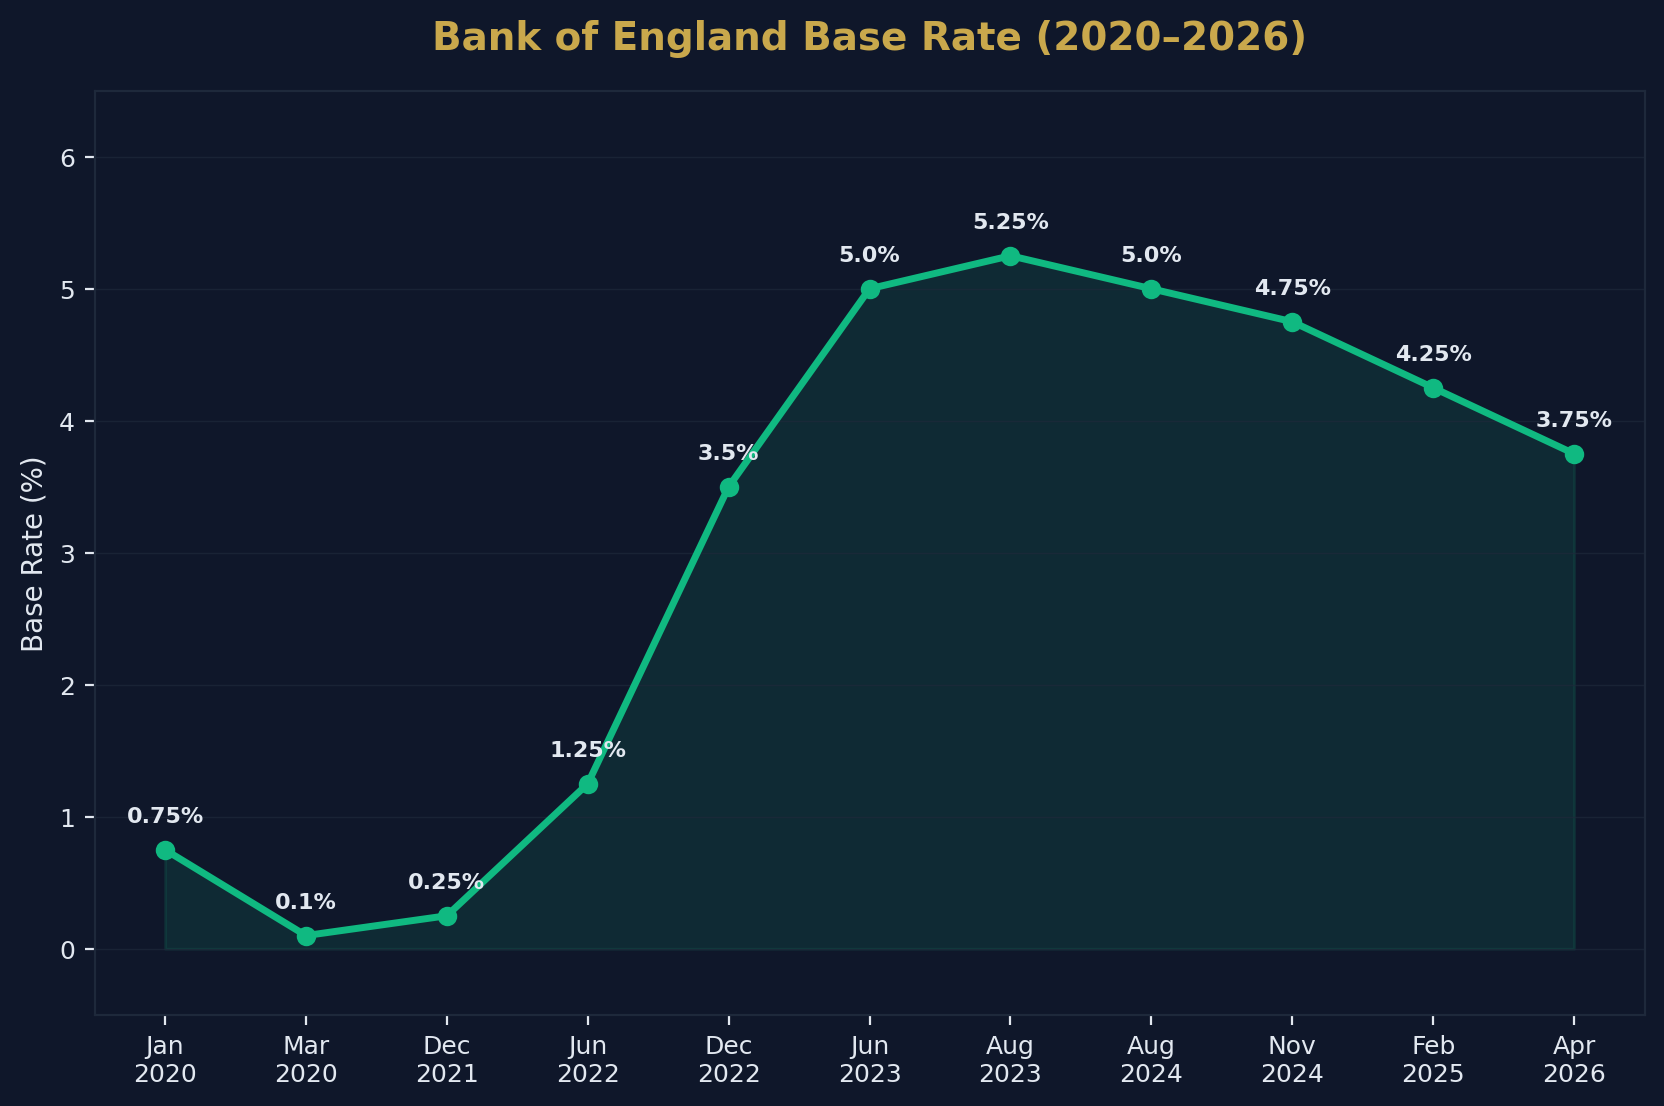
Mortgage Market and Interest Rates
The Bank of England's monetary policy decisions remain the single most influential factor in UK property market dynamics.
Current Rate Environment
| Metric | Figure | Date |
|---|---|---|
| Bank of England base rate | 3.75% | April 2026 |
| Effective rate on new mortgages | 4.10% | February 2026 |
| Rate on outstanding mortgage stock | 3.95% | February 2026 |
| Average BTL rate (2yr fix, 75% LTV) | 3.73% | March 2026 |
| Average advertised 2yr/5yr fixed rates | ~5.0% | April 2026 |
Rate Trajectory
The March 2026 MPC decision held the base rate at 3.75%. Market expectations for further cuts have been disrupted by renewed inflationary pressures linked to geopolitical tensions affecting energy prices. Some analysts are now considering the possibility of rate holds or even increases rather than the cuts previously anticipated.
This uncertainty has fed directly into mortgage pricing. Average advertised fixed rates, which had been trending downward through late 2025, reversed course in April 2026, moving back toward the 5% mark. The gap between the base rate (3.75%) and average fixed-rate products (~5.0%) reflects the risk premium lenders are applying to forward-looking uncertainty.
For investors, the critical calculation is stress-testing rental income against both current and potential higher rates. A rental property that cash-flows positively at a 4% mortgage rate may become marginal at 5.5%.
Foreign Investment in UK Property
Overseas capital continues to flow into UK residential property, albeit at moderated levels compared to the pre-Brexit peak.
Ownership Data
| Metric | Figure |
|---|---|
| Overseas-owned homes (England & Wales) | 202,568 |
| Annual change in overseas ownership | +0.02% |
| Share held in London | 33.9% |
| Share held in South East | 17.2% |
| Share held in North West | 15.9% |
Investor Nationality Breakdown
| Country | Share of Overseas-Owned Properties |
|---|---|
| Hong Kong | 13.8% |
| Singapore | 7.9% |
| USA | 6.8% |
| United Arab Emirates | 5.9% |
| China | 5.8% |
The near-static growth rate (+0.02%) suggests that the 2% non-resident SDLT surcharge, introduced in April 2021, has effectively dampened new overseas acquisitions. However, existing holdings remain substantial — 202,568 properties represent an estimated total value exceeding £60 billion, based on average prices.
The concentration in London (33.9%) reflects the city's status as a global safe-haven asset market. However, the North West's 15.9% share — driven primarily by Manchester and Liverpool off-plan purchases — indicates that overseas investors are increasingly diversifying beyond the capital.
HMO and Multi-Let Sector
Houses in Multiple Occupation represent the highest-yielding mainstream property investment strategy in the UK, but they are also the most heavily regulated.
Market Overview
| Metric | Figure |
|---|---|
| Estimated HMO properties in England | 497,000 |
| Properties under mandatory licensing | 220,000+ |
| Councils with additional licensing schemes | 70+ |
| Councils with Article 4 Directions | 60+ |
| Annual licence applications (latest year) | 57,000 |
| Growth in licence applications since 2018 | +40% |
| Average gross HMO yield (UK) | 8.4% |
Regulatory Intensity
The regulatory environment for HMOs has tightened considerably. Council inspections have increased by 83% since 2018, and enforcement actions — including improvement notices, civil penalty notices, and prosecutions — have risen by 180%.
For investors, the compliance burden is real but manageable. A typical 5-bed HMO in a city with additional licensing will incur licence fees of £500–£1,500 per licence period (usually 5 years), plus mandatory fire safety upgrades (£2,000–£8,000) and ongoing management costs.
The yield premium compensates for this complexity. An HMO generating £2,500/month from a property purchased for £180,000 delivers a gross yield of 16.7% — roughly double the single-let equivalent. After all expenses, net yields of 10–12% are achievable in well-managed operations.
Regional Hotspots
Edinburgh, Oxford, and Bristol lead for HMO licence applications. Emerging growth areas include Sandwell and West Lancashire in the Midlands, where application rates have increased by nearly 1,000% since 2018 — reflecting investor migration from saturated markets toward underserved regions with strong tenant demand.
Property Tax Landscape
The UK's property tax regime has generated record revenues in 2025–26, reflecting both higher transaction volumes and deliberate policy tightening.
Stamp Duty Land Tax (SDLT)
| Metric | Figure |
|---|---|
| Total SDLT receipts (2025–26) | £15.2 billion |
| Year-on-year increase | +9.2% |
| Impact of nil-rate threshold reduction | ~£2,500 additional tax per average-priced home |
| OBR forecast: total property taxes by 2030 | £28 billion |
The April 2025 reduction of the residential nil-rate threshold from £250,000 to £125,000 was the most significant SDLT change since the surcharge introduction. For investors purchasing additional properties, the combined burden (standard rates + 5% surcharge since October 2024) means a £300,000 buy-to-let property now incurs approximately £19,500 in SDLT.
Capital Gains Tax (CGT)
| Metric | Figure |
|---|---|
| Total CGT receipts (2025–26) | £22.2 billion (record) |
| Previous peak | £16.9 billion (2022–23) |
| Annual CGT exemption | £3,000 |
| Residential property CGT rates | 18% (basic) / 24% (higher) |
The record CGT take was partly driven by forestalling — investors disposing of assets ahead of rate increases announced in the October 2024 Budget. The reduction of the annual exemption from £12,300 (2022–23) to £3,000 (2024–25 onwards) has drawn significantly more taxpayers into the CGT net.
For property investors, the practical impact is that almost any property disposal will now trigger a CGT liability. A property purchased for £150,000 and sold for £200,000 generates a £47,000 taxable gain (after the £3,000 exemption), resulting in a tax bill of £8,460 (basic rate) or £11,280 (higher rate).
Market Forecasts: 2026–2030
The major forecasters broadly agree on the trajectory: gradual recovery, regional divergence, and supply-constrained stability.
House Price Growth Forecasts
| Forecaster | 2026 | 2027 | 2028 | 2029 | 2030 | Cumulative |
|---|---|---|---|---|---|---|
| Savills | +2.0% | +4.0% | +5.0% | +5.5% | +4.0% | +22.2% |
| OBR | +2.5% | +2.5% | +2.5% | +2.5% | +2.5% | +16.4% |
| Knight Frank | +3.0% | — | — | — | — | — |
Regional Outlook (Savills, to 2030)
| Region | Forecast Cumulative Growth |
|---|---|
| North East | 27%+ |
| North West | 27%+ |
| Yorkshire & The Humber | 27%+ |
| Scotland | 27%+ |
| Wales | 27%+ |
| East Midlands | 24% |
| West Midlands | 23% |
| South West | 20% |
| East of England | 18% |
| South East | 16% |
| London | 13.6% |
The North–South divergence is projected to widen through the decade. Savills expects northern regions to deliver double London's growth rate by 2030, driven by superior affordability, stronger rental demand, and accelerating infrastructure investment (including HS2 phases and devolution-funded urban regeneration).
Key Variables
The accuracy of these forecasts depends on several uncertain factors:
- Interest rate path: If the Bank of England holds or raises rates due to inflationary pressures, the 2027–2028 acceleration may be delayed.
- Housing supply: The OBR forecasts net additions rising to 305,000 annually by 2030–31. If planning reforms deliver, price growth may moderate. If they stall, supply constraints will support prices.
- Tax policy: Further SDLT or CGT changes could alter investor behaviour, particularly in the BTL sector.
- Geopolitical factors: Energy price volatility and trade disruptions remain significant wildcards for mortgage pricing and consumer confidence.
Housing Supply and New Builds
The UK's chronic housing undersupply remains the structural foundation supporting long-term property values. The government's target of 300,000 new homes per year has never been met.
Supply Pipeline
Net additions to housing stock have averaged approximately 230,000–245,000 per year over the past five years. The OBR projects this figure will dip in 2026–27 as developers adjust to higher construction costs and planning uncertainties, before recovering to over 305,000 by 2030–31 — driven by planning reform implementation.
Build Cost Pressures
Construction material costs have stabilised after the extreme volatility of 2021–2023 but remain approximately 25% above pre-pandemic levels. Labour costs in the construction sector have increased by approximately 18% since 2020, reflecting both wage inflation and post-Brexit skills shortages.
These cost pressures have a direct impact on new-build pricing. The premium for new-build properties over existing stock has widened to approximately 15–20% in most markets, making second-hand properties relatively more attractive for yield-focused investors.
Methodology and Data Sources
All statistics cited in this article are sourced from official government publications, central bank releases, and established industry research. The primary sources are:
| Source | Data Type | Release Frequency | URL |
|---|---|---|---|
| ONS UK House Price Index | House prices, affordability | Monthly | ons.gov.uk |
| ONS Private Rental Index | Rental prices by region | Monthly | ons.gov.uk |
| HM Land Registry | Transaction prices (Price Paid) | Monthly | gov.uk/land-registry |
| HMRC Property Transactions | Monthly transaction volumes | Monthly | gov.uk/hmrc |
| HMRC SDLT Statistics | Stamp Duty revenue | Quarterly | gov.uk/hmrc |
| HMRC CGT Statistics | Capital Gains Tax receipts | Annual | gov.uk/hmrc |
| Bank of England | Base rate, mortgage data | Monthly | bankofengland.co.uk |
| UK Finance | Mortgage market reports | Quarterly | ukfinance.org.uk |
| RICS | Market sentiment surveys | Monthly | rics.org |
| Savills Research | Forecasts, market analysis | Quarterly | savills.co.uk |
| Knight Frank | Forecasts, global context | Quarterly | knightfrank.co.uk |
| OBR | Economic and fiscal forecasts | Biannual | obr.uk |
| English Housing Survey | Tenure, demographics | Annual | gov.uk |
| Companies House | BTL company registrations | Monthly | companieshouse.gov.uk |
Where market estimates are used (e.g., rental yields by city), these are clearly identified as estimates derived from multiple industry sources and cross-referenced against available ONS and Land Registry data.
How to Cite This Page
If you are referencing these statistics in your own content, you can use the following citation:
UK Property Investment Statistics 2026. Shaded Canvas. Published April 2026, updated quarterly. Available at: https://blog.shadedcanvas.co.uk/post/uk-property-investment-statistics-2026
What These Numbers Mean for Investors
Data without context is just noise. Here is what the 2026 statistics landscape means for different investor profiles:
For Buy-to-Let Investors
The numbers confirm that northern cities remain the yield play. A BTL investor purchasing a £180,000 terraced house in Newcastle can expect gross yields of 8.7%, compared to 4.3% for a similar investment in London valued at £450,000+. The incorporation trend (75–80% of new purchases through limited companies) is now the default approach for tax-efficient portfolio building. Increasingly, professional landlords also outsource acquisition itself, buying through property sourcing services or deal packaging specialists rather than competing for on-market stock.
For First-Time Buyers
Affordability is improving — the HPER of 4.7 is the most favourable in years — but the deposit barrier remains formidable. The data suggests that buyers outside London and the South East face a significantly more accessible market, with areas like Burnley and Hartlepool offering entry points below £100,000.
For HMO Operators
The 8.4% average gross yield for HMOs underscores why this strategy remains dominant among professional landlords. However, the 180% increase in enforcement actions since 2018 is a clear warning: non-compliant operations face escalating penalties. The data strongly favours investors who treat licensing and fire safety as core operational requirements, not afterthoughts.
For International Investors
Overseas ownership growth has flatlined at +0.02%, suggesting the 2% SDLT surcharge is functioning as a meaningful deterrent. However, the data also shows that international capital is diversifying from London (33.9% share) toward the North West (15.9%). Investors willing to accept the surcharge are finding better value propositions outside the capital.
For Long-Term Portfolio Builders
The Savills forecast of 22.2% cumulative growth by 2030 — with northern regions potentially exceeding 27% — provides a compelling case for acquisition in the current cycle. At the OBR's more conservative 16.4% projection, a £250,000 property purchased today would be valued at approximately £291,000 by 2030–31, representing £41,000 in paper capital growth before any rental income or leverage effects.
Stop being a landlord. Start being an investor.
Shaded Canvas introduces serious capital to vetted UK property opportunities — targeting 12–16% net returns.
Start Investing →