

The UK mortgage market underpins the entire housing economy — and in 2026 it is navigating one of the most complex rate environments in a generation. This page consolidates every critical mortgage statistic for 2026, from outstanding balances and lending volumes to interest rates, affordability metrics, and the 1.8 million fixed-rate deals maturing this year.
Whether you are a borrower comparing rates, a broker advising clients, or a researcher tracking monetary policy transmission, this is the definitive reference.
Last Updated: April 2026 | Next Update: July 2026
Key Mortgage Statistics at a Glance
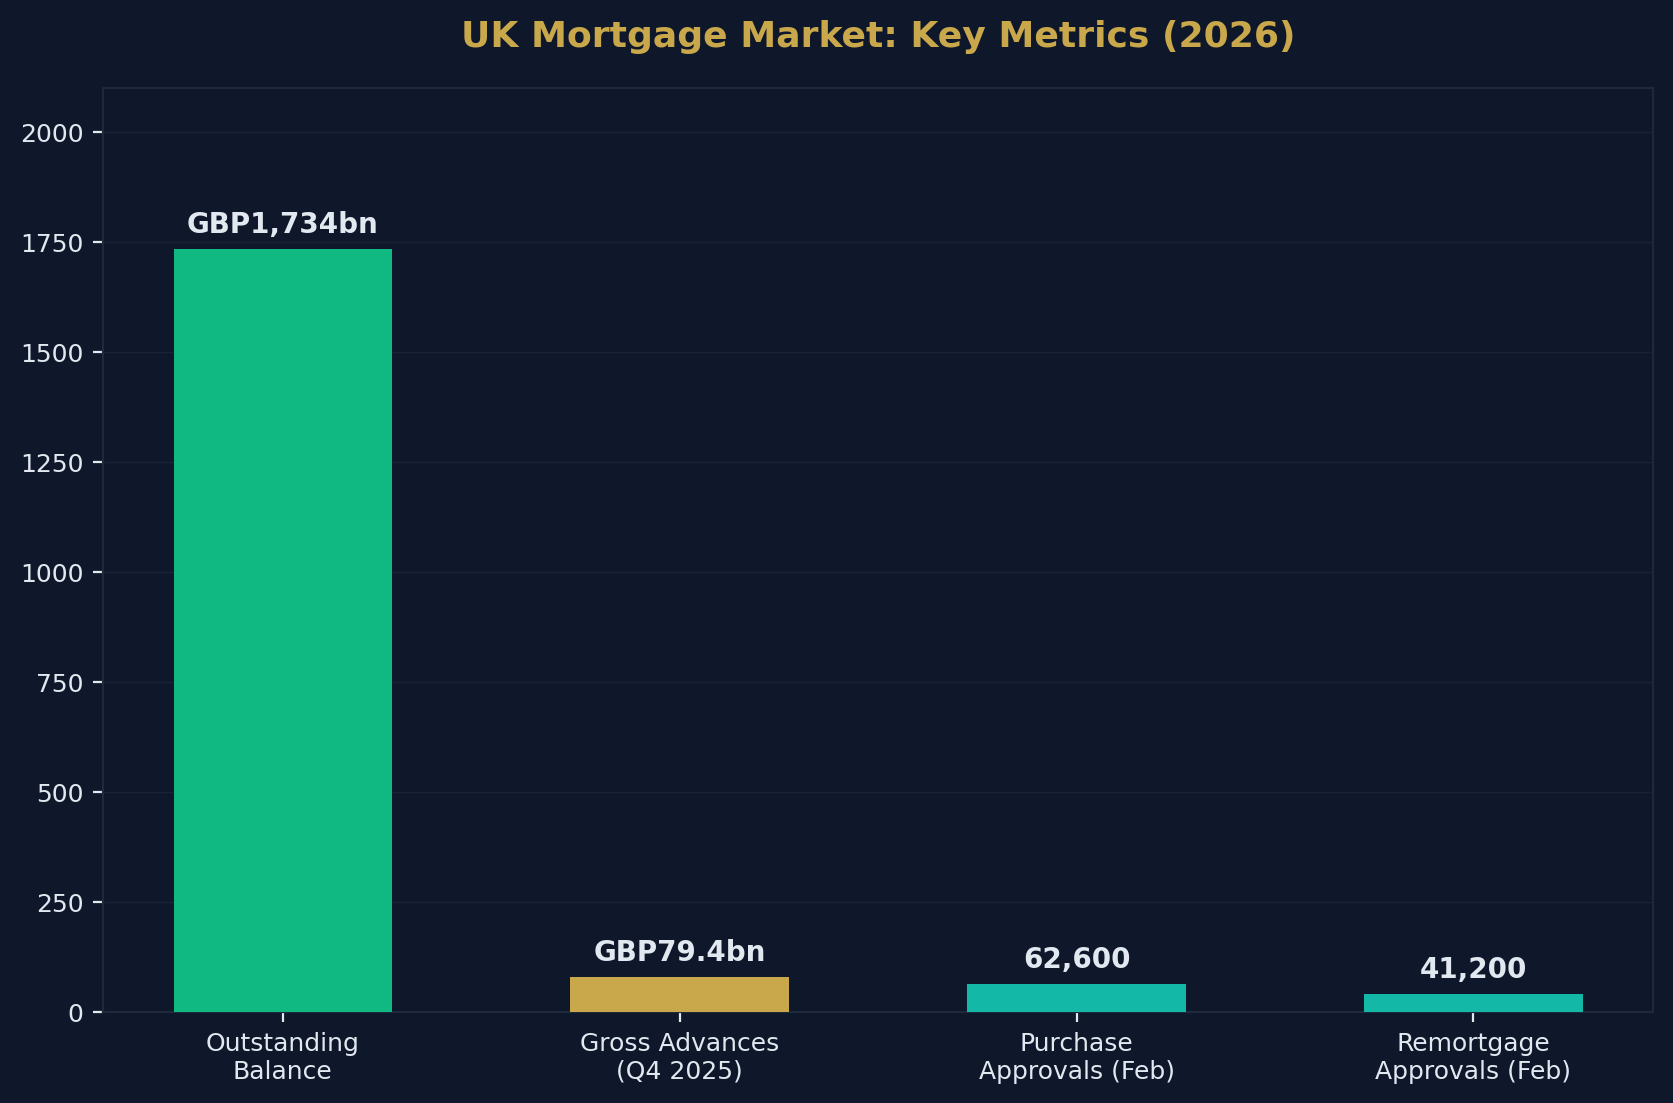
- Total outstanding UK mortgage lending: £1,734.4 billion — the highest on record (FCA, Q4 2025).
- Outstanding mortgage balances grew 3.0% year-on-year — the fastest pace since 2022.
- Gross mortgage advances in Q4 2025: £79.4 billion.
- Net mortgage approvals for house purchases (Feb 2026): 62,600.
- Remortgage approvals (Feb 2026): 41,200.
- The BoE base rate is 3.75% (held since November 2025).
- The effective rate on newly drawn mortgages: 4.10%.
- The rate on the outstanding mortgage stock: 3.95%.
- Average 2-year fixed rate: ~5.8% (market average, April 2026).
- Average 5-year fixed rate: ~5.7% (market average, April 2026).
- Average SVR: ~7.1–7.6%.
- Approximately 1.8 million fixed-rate mortgages will mature in 2026.
- First-time buyer mortgage payments average ~32% of take-home pay.
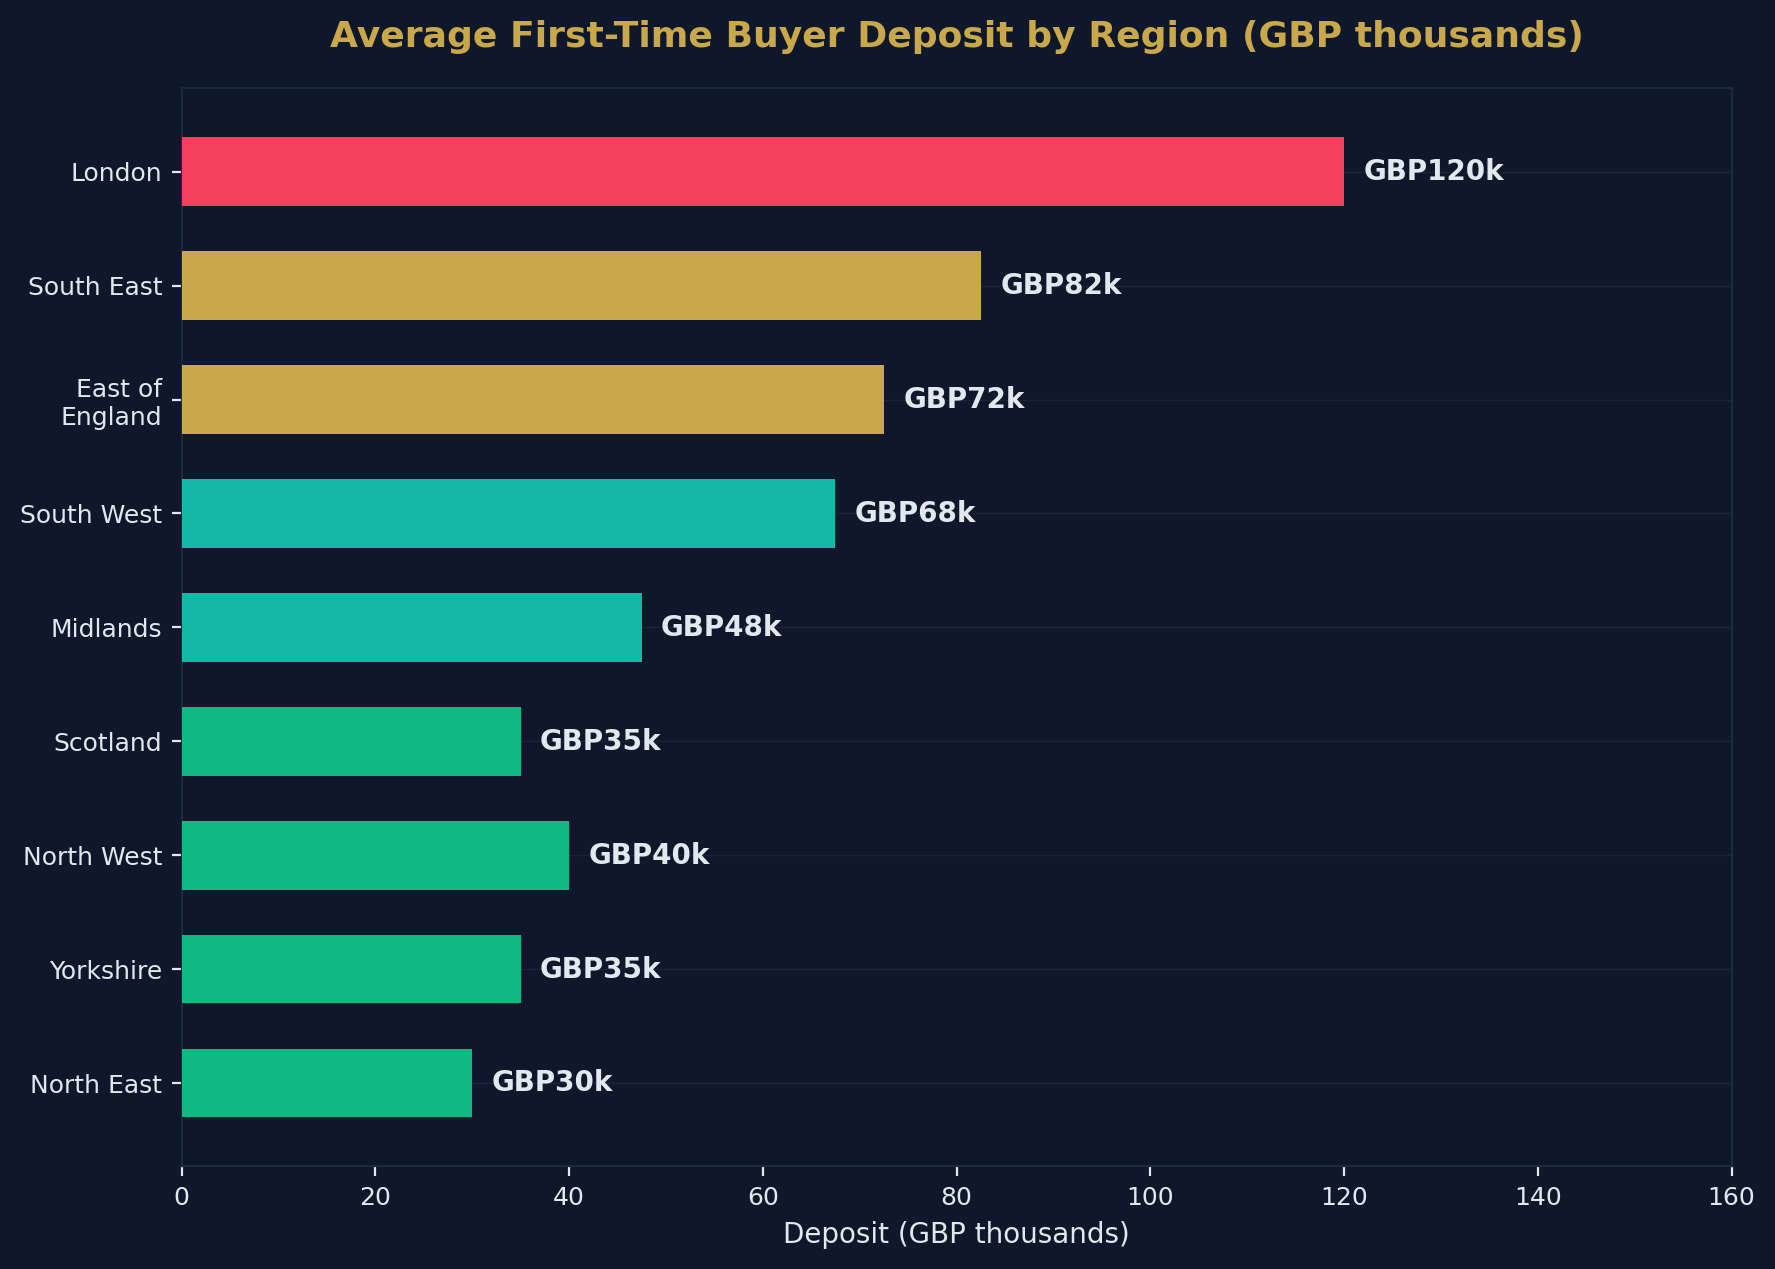
- Average FTB deposit: £61,000–£89,000 (20–25% of purchase price).
- Standard lending cap: 4.0–4.5x household income; some lenders offer up to 6x.
- Mortgage terms of 35+ years are increasingly standard for affordability.
Source: Shaded Canvas analysis of Bank of England, FCA MLAR, UK Finance, ONS, and Moneyfacts data. Last updated April 2026.
Outstanding Mortgage Lending
Total Mortgage Stock
| Period | Outstanding Balance | QoQ Change | YoY Change |
|---|---|---|---|
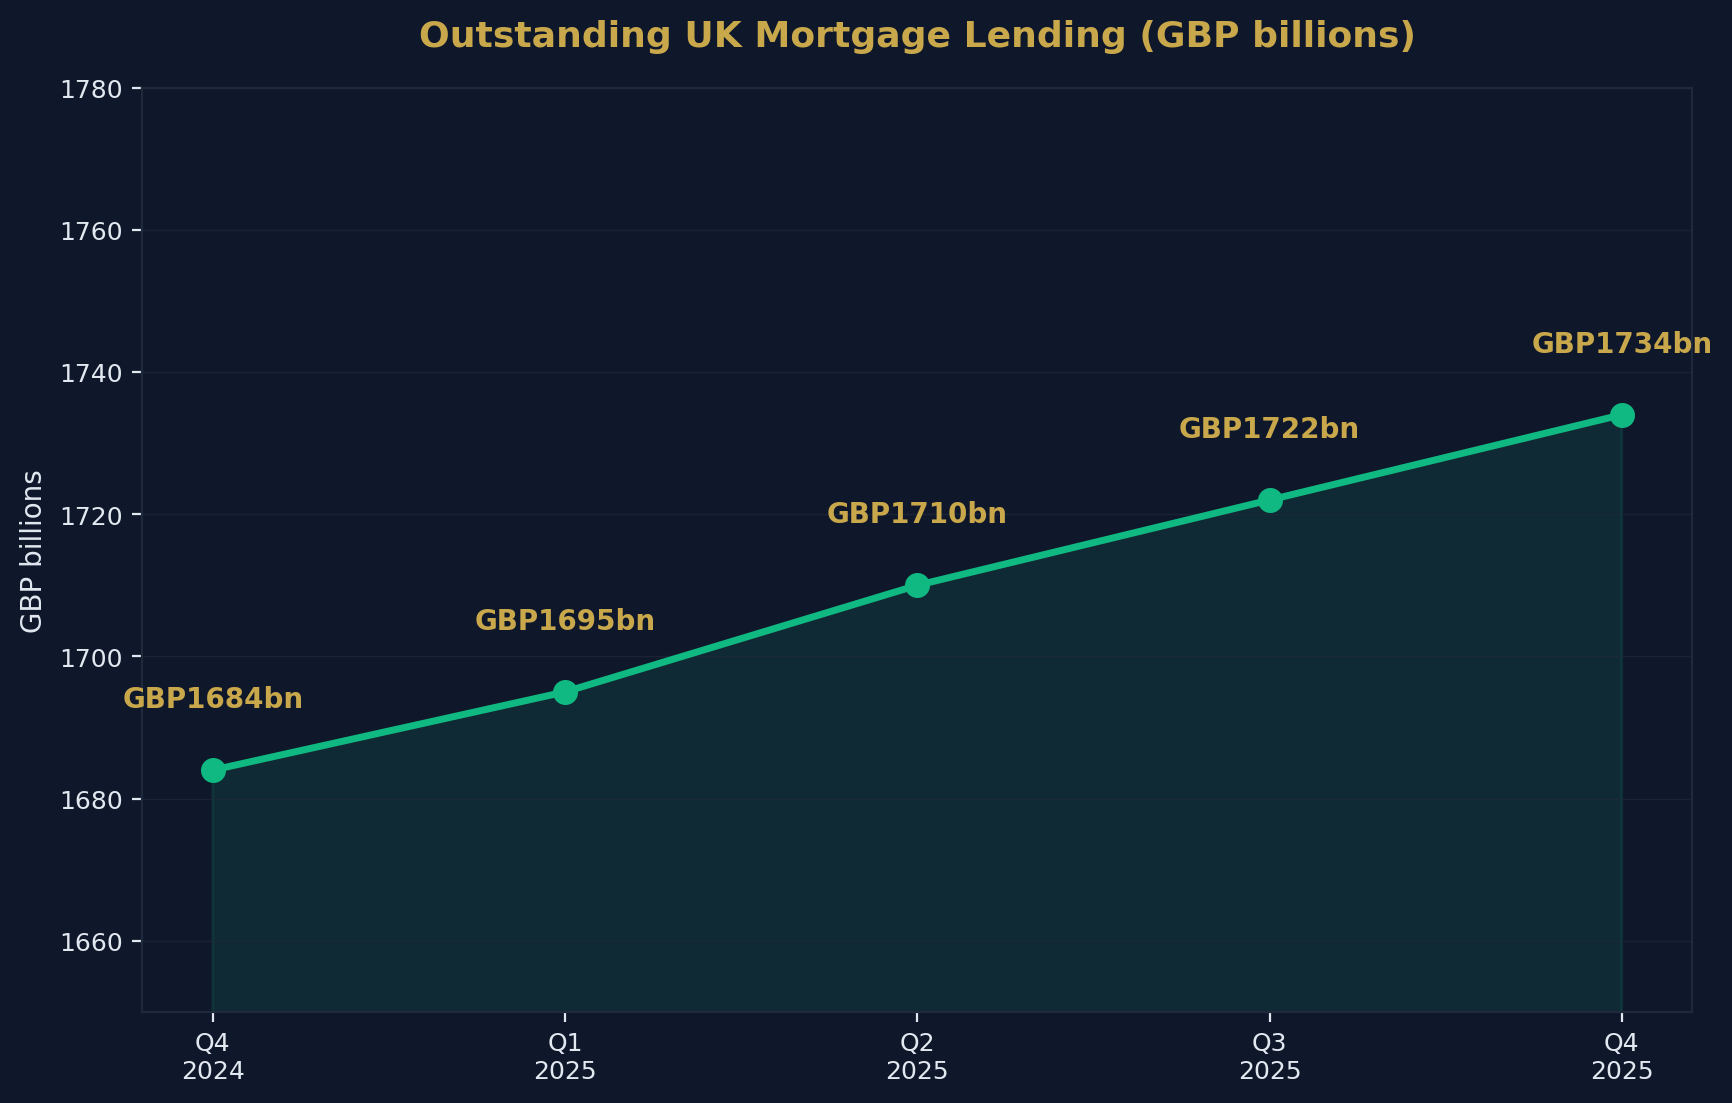
| Q4 2024 | £1,684 billion | — | — |
| Q1 2025 | £1,695 billion | +0.7% | +2.1% |
| Q2 2025 | £1,710 billion | +0.9% | +2.5% |
| Q3 2025 | £1,722 billion | +0.7% | +2.8% |
| Q4 2025 | £1,734 billion | +0.8% | +3.0% |
The £1,734 billion outstanding balance is the highest since FCA reporting began in 2007, reflecting both rising house prices and continued new lending.
Mortgage Approvals and Lending
Monthly Approvals (Seasonally Adjusted)
| Month | Purchase Approvals | Remortgage Approvals |
|---|---|---|
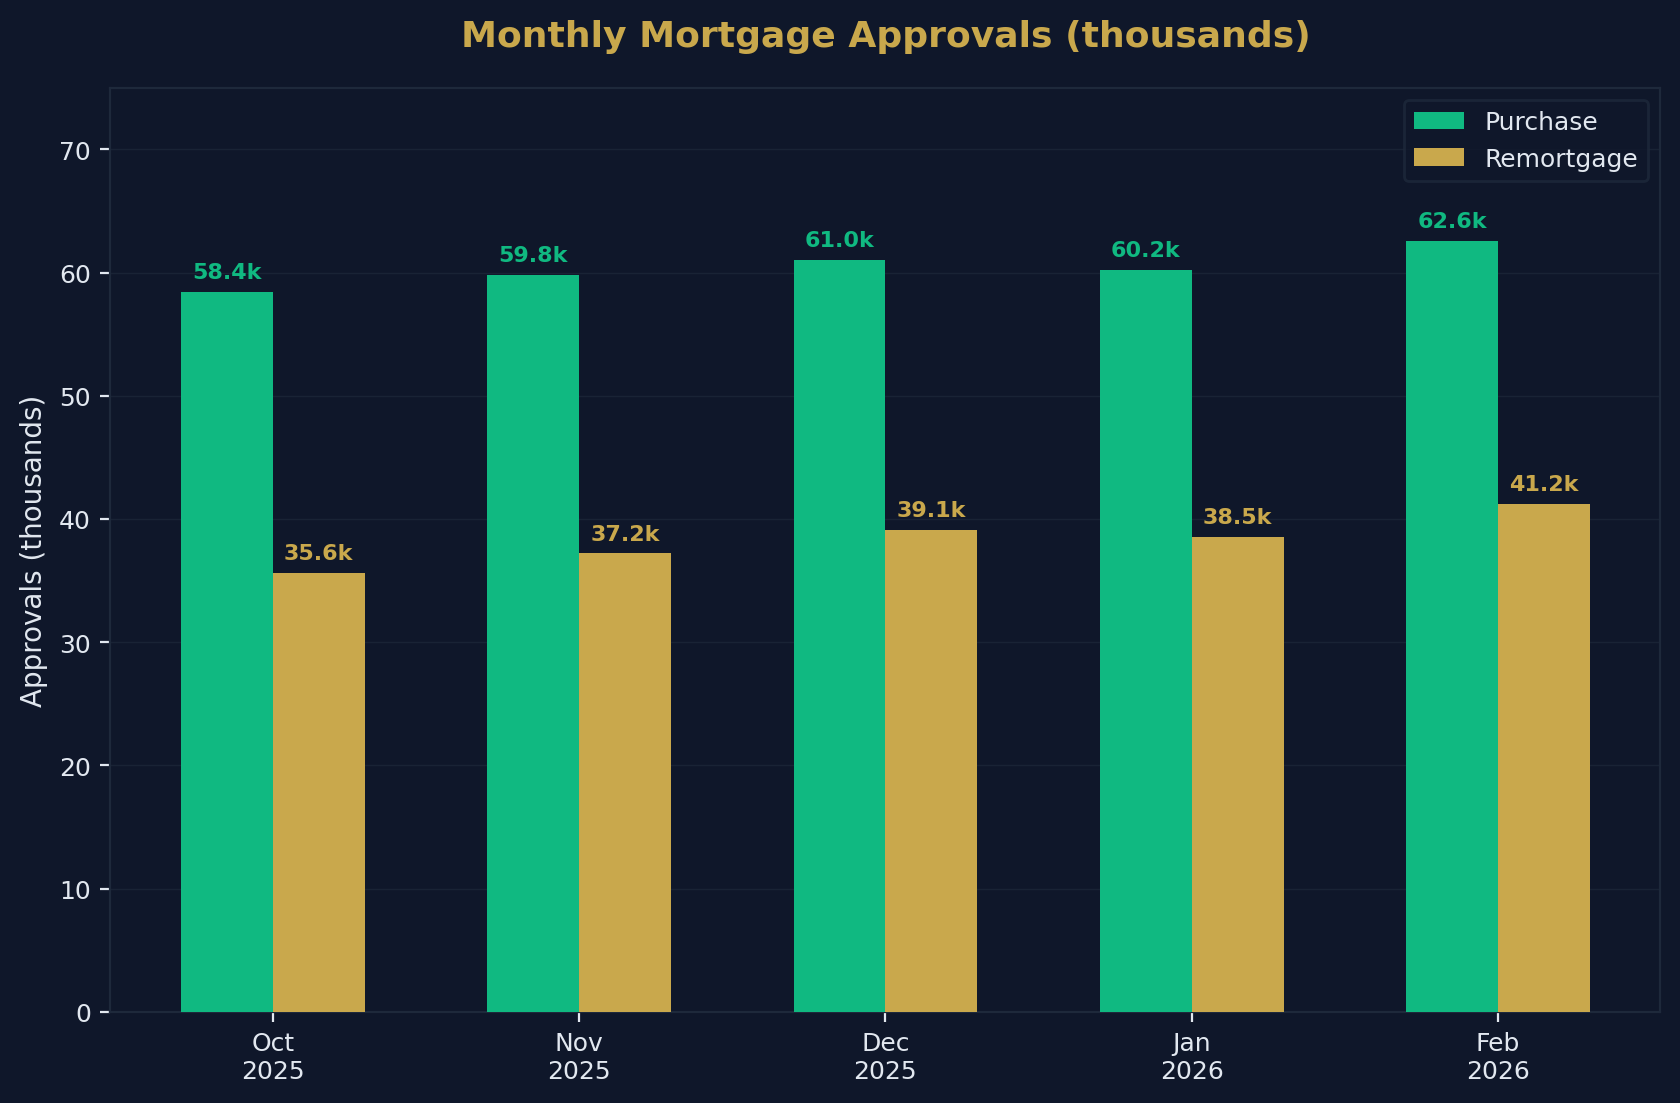
| October 2025 | 58,400 | 35,600 |
| November 2025 | 59,800 | 37,200 |
| December 2025 | 61,000 | 39,100 |
| January 2026 | 60,200 | 38,500 |
| February 2026 | 62,600 | 41,200 |
Gross Lending (Quarterly)
| Quarter | Gross Advances | YoY Change |
|---|---|---|
| Q1 2025 | £68.2 billion | +12% |
| Q2 2025 | £72.5 billion | +15% |
| Q3 2025 | £75.8 billion | +18% |
| Q4 2025 | £79.4 billion | +21% |
The 2026 Remortgage Wave
Approximately 1.8 million fixed-rate mortgages are scheduled to mature in 2026 — the largest refinancing cohort in UK history. Most of these deals were taken out during the 2021 <a href="/post/stamp-duty-on-buy-to-let" style="color:#c9a84c;text-decoration:underline;font-weight:500">stamp duty holiday when rates were below 2%.
Borrowers rolling off these deals face significant payment increases:
- From 1.5% to 4.5% on a £200,000 mortgage = +£280/month increase
- From 2.0% to 5.0% on a £250,000 mortgage = +£380/month increase
This "mortgage cliff" is the primary affordability headwind for the housing market in 2026. It is also generating a steady flow of motivated sellers, which is why property sourcing agents report rising demand from investors looking for discounted stock in 2026.
Interest Rate Environment
Rate History and Current Position
| Date | BoE Base Rate | Avg 2yr Fixed | Avg 5yr Fixed | Effective Rate (New) |
|---|---|---|---|---|
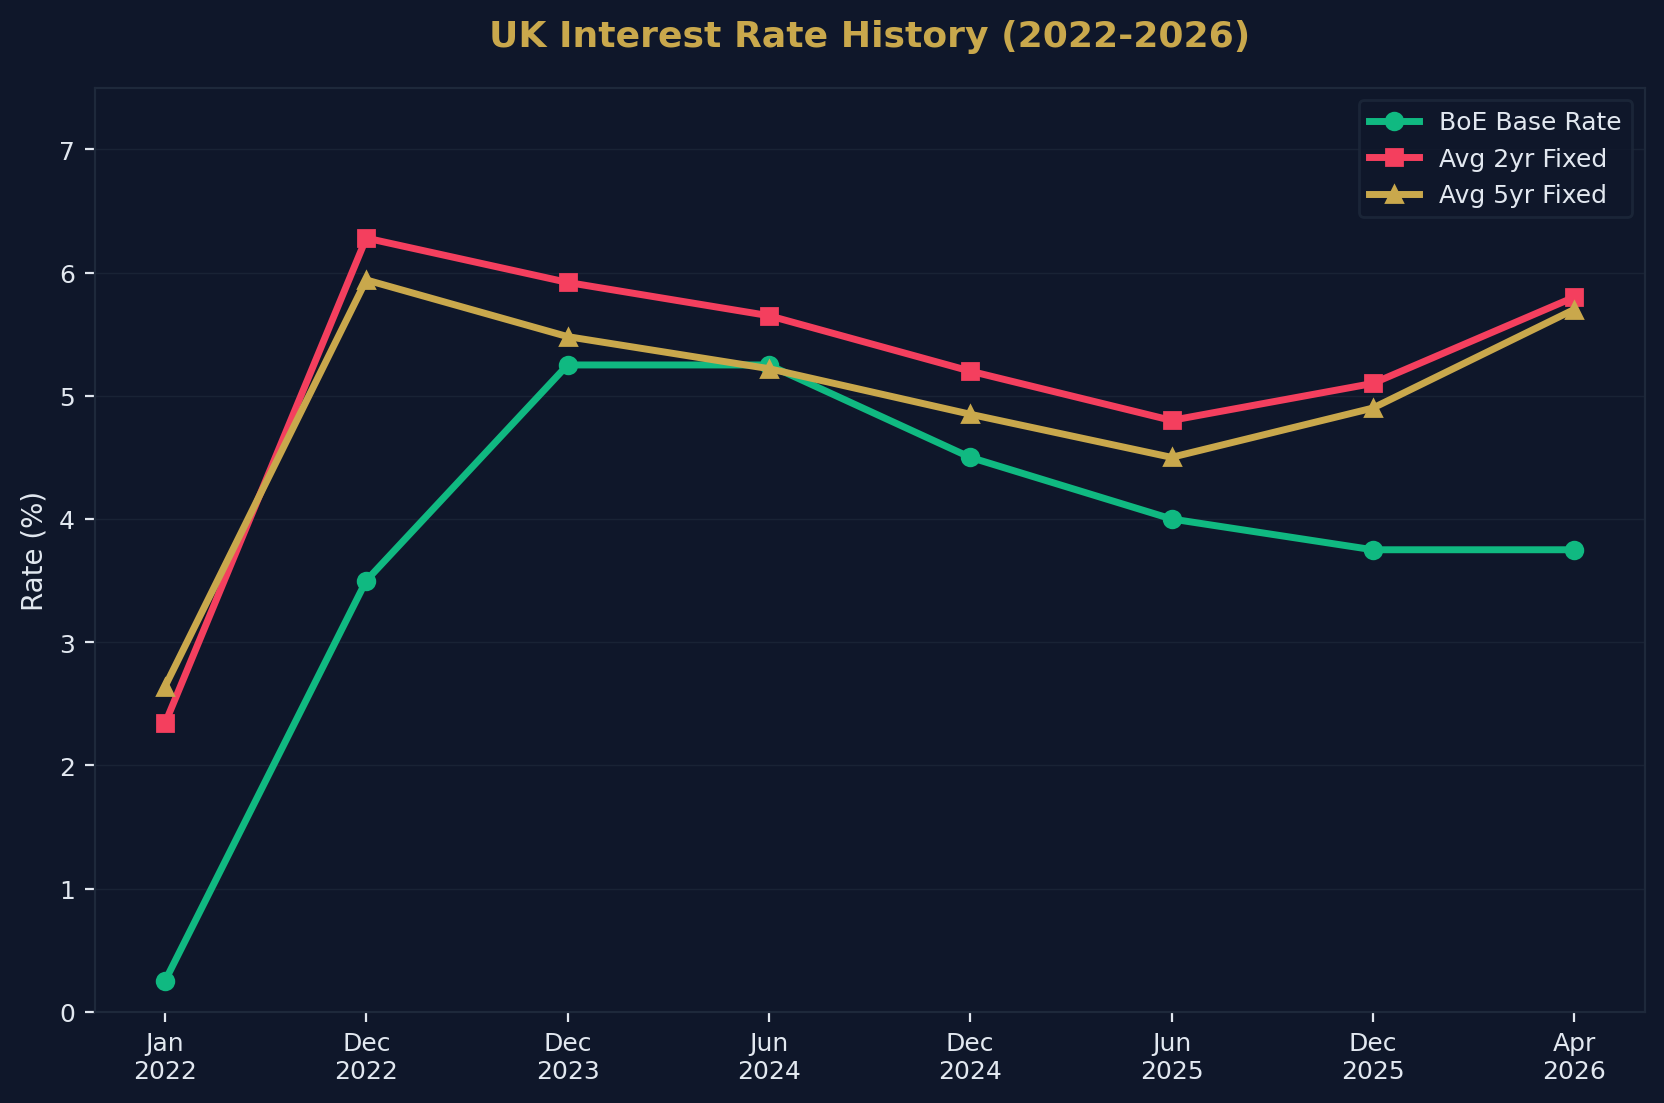
| Jan 2022 | 0.25% | 2.34% | 2.64% | 1.59% |
| Dec 2022 | 3.50% | 6.28% | 5.94% | 3.45% |
| Dec 2023 | 5.25% | 5.92% | 5.48% | 4.82% |
| Jun 2024 | 5.25% | 5.65% | 5.22% | 4.66% |
| Dec 2024 | 4.50% | 5.20% | 4.85% | 4.35% |
| Jun 2025 | 4.00% | 4.80% | 4.50% | 4.15% |
| Dec 2025 | 3.75% | 5.10% | 4.90% | 4.10% |
| Apr 2026 | 3.75% | 5.80% | 5.70% | 4.10% |
Why Fixed Rates Rose Despite Base Rate Cuts
A common question: how can fixed mortgage rates increase when the BoE base rate has been cut? The answer lies in swap rates — the wholesale cost of funding that lenders use to price fixed-rate products.
Swap rates are driven by:
- Inflation expectations — which surged in early 2026 due to Middle East energy disruption
- Government bond yields — which reflect fiscal risk and debt market confidence
- Global capital flows — which respond to geopolitical uncertainty
The base rate influences variable/tracker rates directly, but fixed rates are priced off swap markets — which can move independently.
Mortgage Affordability
Monthly Payments as Share of Income
| Buyer Type | Monthly Payment (avg) | Share of Take-Home Pay |
|---|---|---|
| First-time buyer (20% deposit) | ~£1,050 | ~32% |
| Home mover (25% equity) | ~£950 | ~28% |
| Buy-to-let (interest-only, 75% LTV) | ~£700 | N/A (covered by rent) |
Average First-Time Buyer Deposit
| Region | Average FTB Deposit | As % of Purchase Price |
|---|---|---|
| <a href="/post/foreign-investment-in-london-real-estate" style="color:#c9a84c;text-decoration:underline;font-weight:500">London | £120,000+ | 25%+ |
| South East | £75,000–£90,000 | 20–23% |
| South West | £60,000–£75,000 | 20–22% |
| East of England | £65,000–£80,000 | 20–22% |
| Midlands | £40,000–£55,000 | 20–22% |
| North West | £35,000–£45,000 | 18–20% |
| Yorkshire | £30,000–£40,000 | 18–20% |
| North East | £25,000–£35,000 | 18–20% |
| <a href="/post/property-investment-scotland" style="color:#c9a84c;text-decoration:underline;font-weight:500">Scotland | £30,000–£40,000 | 18–20% |
The Affordability Paradox
Despite higher rates, affordability has improved marginally from its 2023 peak because:
- Wage growth has outpaced house price growth since 2024
- Longer mortgage terms (35+ years) reduce monthly payments
- Higher LTI lending (up to 6x income) extends borrowing capacity
- House price stagnation in expensive regions has improved ratios
However, the structural affordability challenge remains: deposits are still the primary barrier, with the average FTB needing 6–8 years of savings.
Lending by Borrower Type
Share of Mortgage Lending
| Borrower Type | Share of New Lending | Avg LTV | Avg LTI |
|---|---|---|---|
| First-time buyers | ~30% | 80–85% | 3.8x |
| Home movers | ~25% | 70–75% | 3.5x |
| Remortgagers | ~35% | 60–70% | N/A |
| BTL purchases | ~10% | 70–75% | N/A |
Mortgage Term Distribution
| Term Length | Share of New Mortgages |
|---|---|
| Up to 25 years | ~25% |
| 26–30 years | ~30% |
| 31–35 years | ~30% |
| 36–40 years | ~15% |
The shift toward 35+ year terms is one of the most significant structural changes in the mortgage market. In 2015, fewer than 10% of new mortgages exceeded 30 years. Today, 45% do.
Arrears and Repossessions
Mortgage Stress Indicators
| Metric | Q4 2025 | Q4 2024 | Change |
|---|---|---|---|
| Mortgages in arrears (>2.5% of balance) | 107,700 | 100,200 | +7.5% |
| Arrears rate | ~1.1% | ~1.0% | +0.1pp |
| Repossessions (quarterly) | ~1,400 | ~1,200 | +17% |
| Repossession rate | ~0.014% | ~0.012% | +0.002pp |
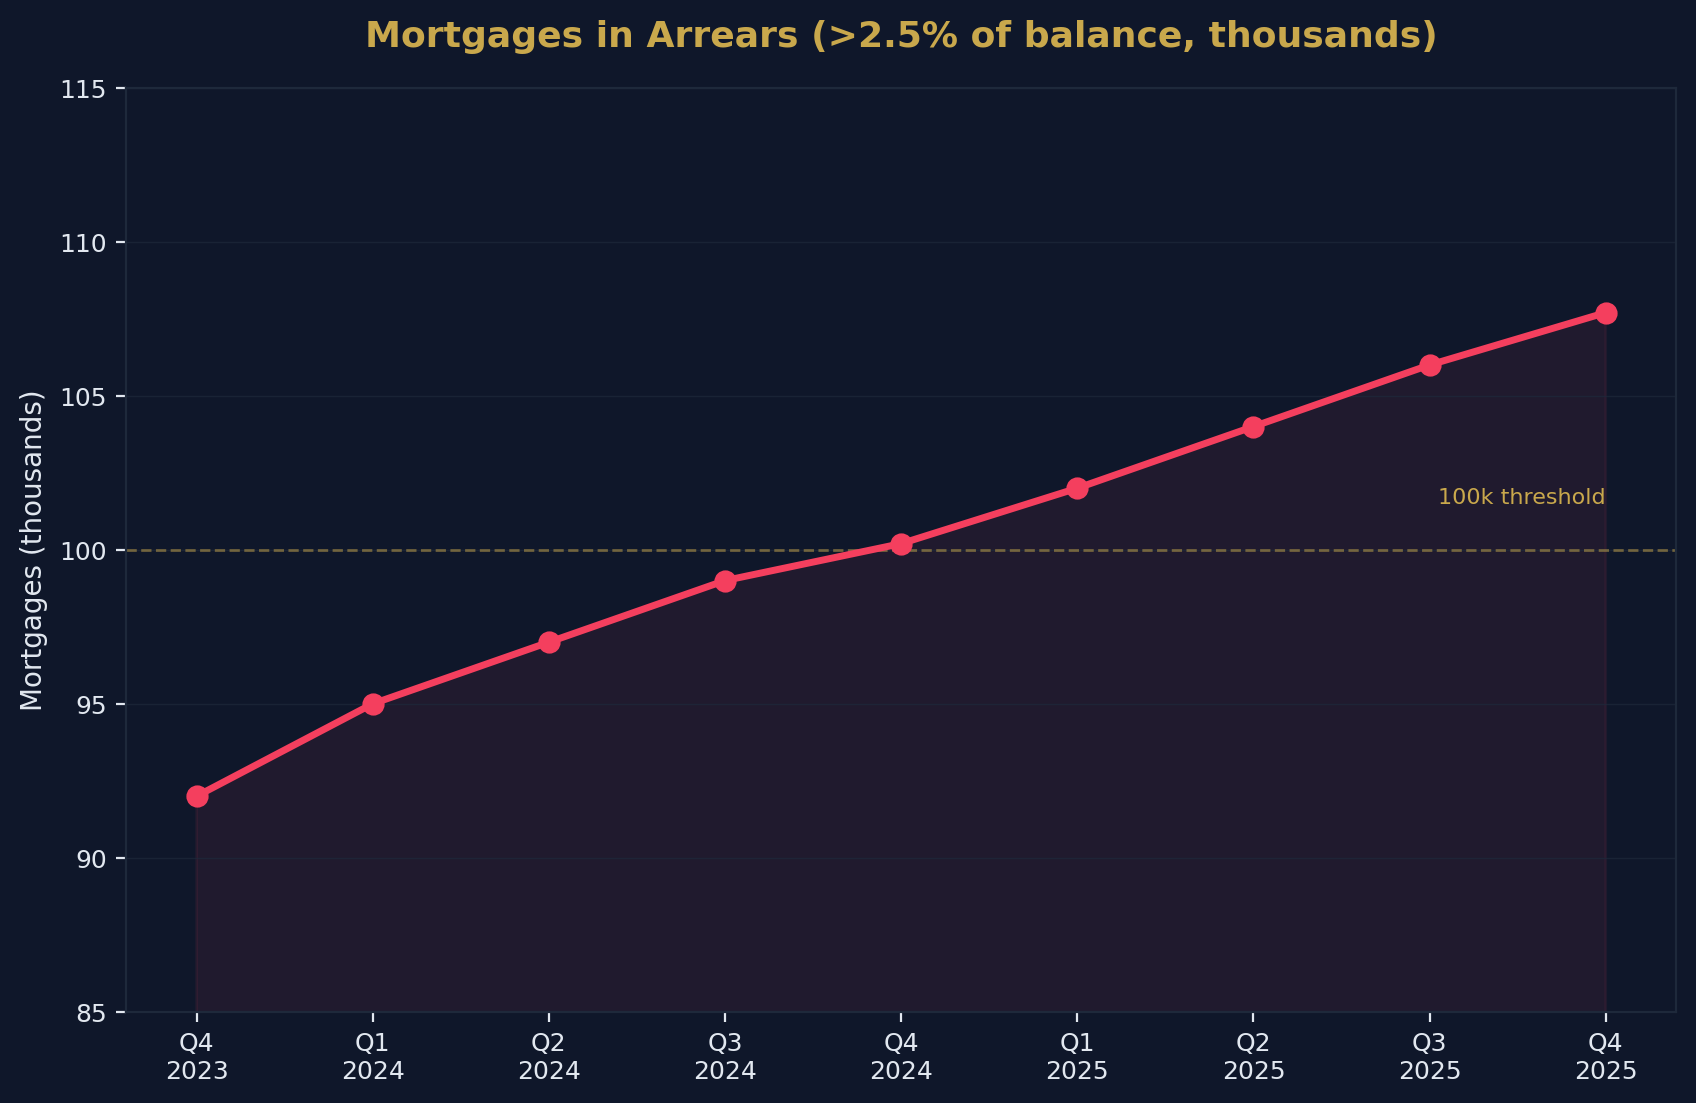
While arrears have increased, the 1.1% arrears rate remains well below the 3.5%+ peak seen during the 2009 financial crisis. The mortgage market is under stress but not in crisis — lenders have robust forbearance frameworks, and unemployment remains low.
Rate Forecast
Where Rates Are Heading
| Scenario | Base Rate (end 2027) | 2yr Fixed (indicative) |
|---|---|---|
| Bull case | 2.5–3.0% | 3.5–4.0% |
| Base case | 3.0–3.5% | 4.0–4.5% |
| Bear case | 3.75–4.25% | 5.5–6.0% |
The consensus view remains that rates will trend lower through 2027–2028, but the pace depends entirely on inflation trajectory and geopolitical stability.
Methodology and Data Sources
| Source | Data Type | Coverage |
|---|---|---|
| Bank of England | Approvals, effective rates, base rate | UK |
| FCA MLAR | Outstanding balances, gross advances | UK |
| UK Finance | Lending forecasts, product data | UK |
| Moneyfacts | Average product rates (fixed, SVR) | UK |
| ONS | Earnings, affordability | UK |
| English Housing Survey | Tenure, deposit data | England |
How to Cite This Page
UK Mortgage Statistics 2026. Shaded Canvas. Published April 2026, updated quarterly. Available at: https://blog.shadedcanvas.co.uk/post/uk-mortgage-statistics-2026
Stop being a landlord. Start being an investor.
Shaded Canvas introduces serious capital to vetted UK property opportunities — targeting 12–16% net returns.
Start Investing →