The UK buy-to-let sector is in the middle of its most significant structural transformation since Section 24 was announced in 2015. This page consolidates every critical BTL statistic for 2026 — from mortgage lending volumes and landlord demographics to limited company trends, portfolio sizes, regulatory compliance costs, and the real numbers behind the "landlord exodus" narrative.
Whether you are a landlord benchmarking your portfolio, a mortgage broker advising investors, or a researcher analysing the private rented sector, this is the definitive reference.
Last Updated: April 2026 | Next Update: July 2026
Key Buy-to-Let Statistics at a Glance
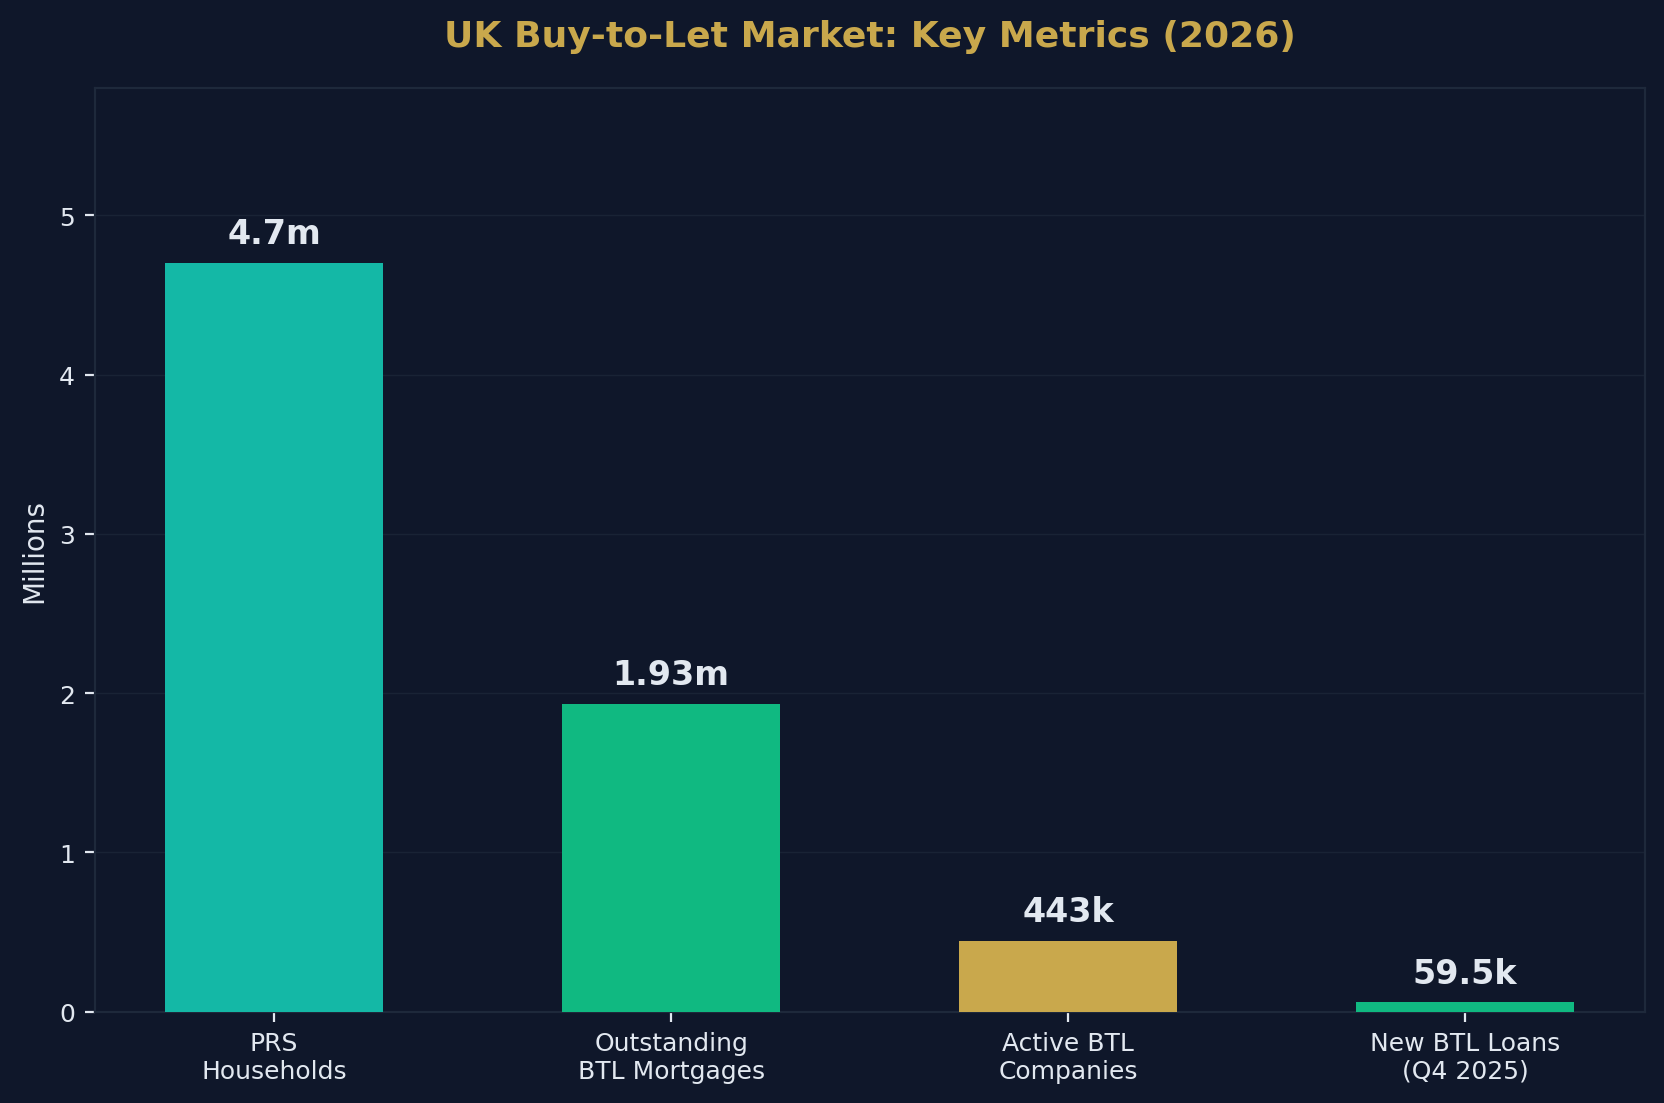
- There are approximately 4.7 million privately rented households in the UK (~19% of all households).
- The average UK monthly private rent is £1,374 (ONS, February 2026).
- Annual rent inflation has cooled to 3.4% — the lowest rate since March 2022.
- There are 1.46 million fixed-rate BTL mortgages outstanding (+2% YoY).
- There are 466,000 variable-rate BTL mortgages outstanding (-9.8% YoY).
- In Q4 2025, 59,489 new BTL loans were advanced totalling £11.2 billion (+21.3% by value).
- The average BTL 2-year fixed rate (75% LTV) is approximately 3.73% (March 2026).
- The average interest cover ratio (ICR) for UK BTL is 218% — up from 201% a year earlier.
- BTL arrears (>2.5%) affected only 9,520 mortgages at end of 2025.
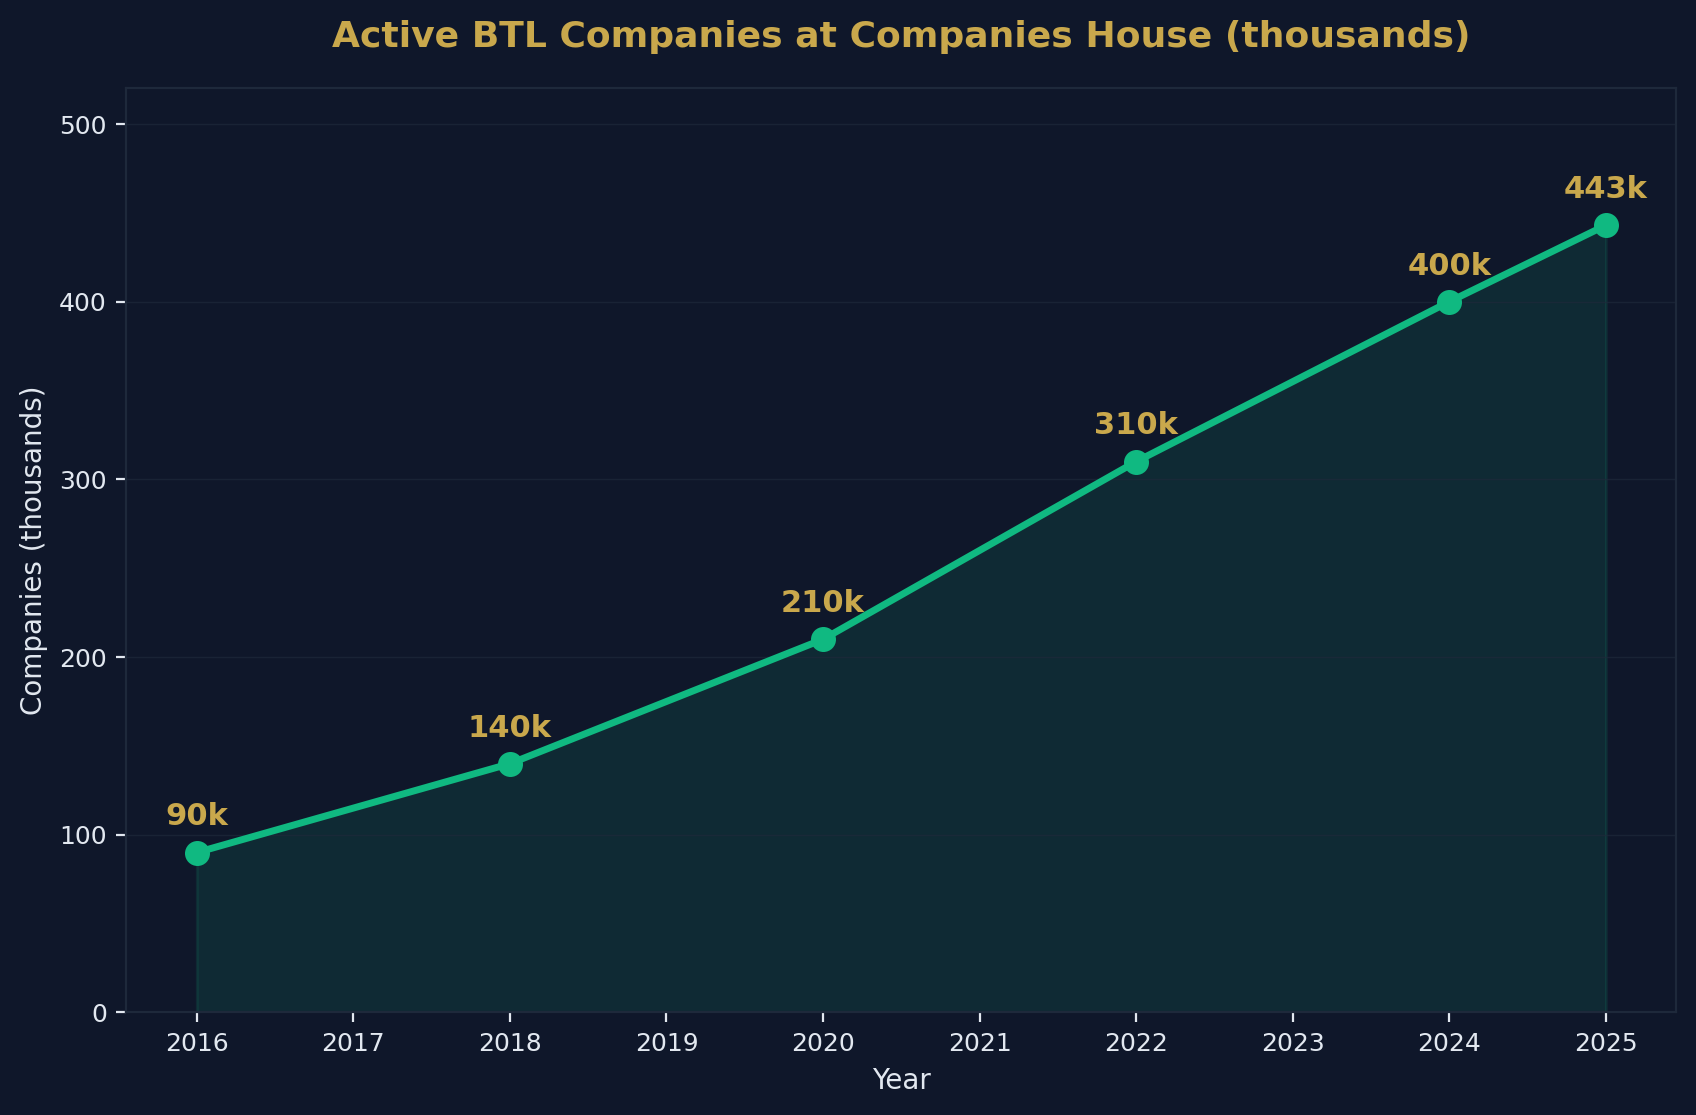
- There are 443,272 active BTL limited companies — nearly 5x the 2016 figure.
- 75–80% of all new BTL purchases are now made via limited companies.
- 45% of landlords own a single rental property; 38% own 2–4 properties.
- The median landlord age is 59 years old; two-thirds are aged 55+.
- 55% of landlords are male, 44% female.
- Two-thirds of landlords plan growth activity (acquisitions, refurbs, or refinancing) in 2026.
- 39% of landlords plan to refinance in 2026 due to maturing fixed-rate deals.
- Making Tax Digital applies from April 2026 for landlords with >£50,000 gross rental income.
Source: Shaded Canvas analysis of UK Finance, ONS, HMRC, Hamptons, Companies House, and English Landlord Survey data. Last updated April 2026.
BTL Mortgage Market
Lending Volumes
| Period | New BTL Loans | Value | YoY Change (Value) |
|---|---|---|---|
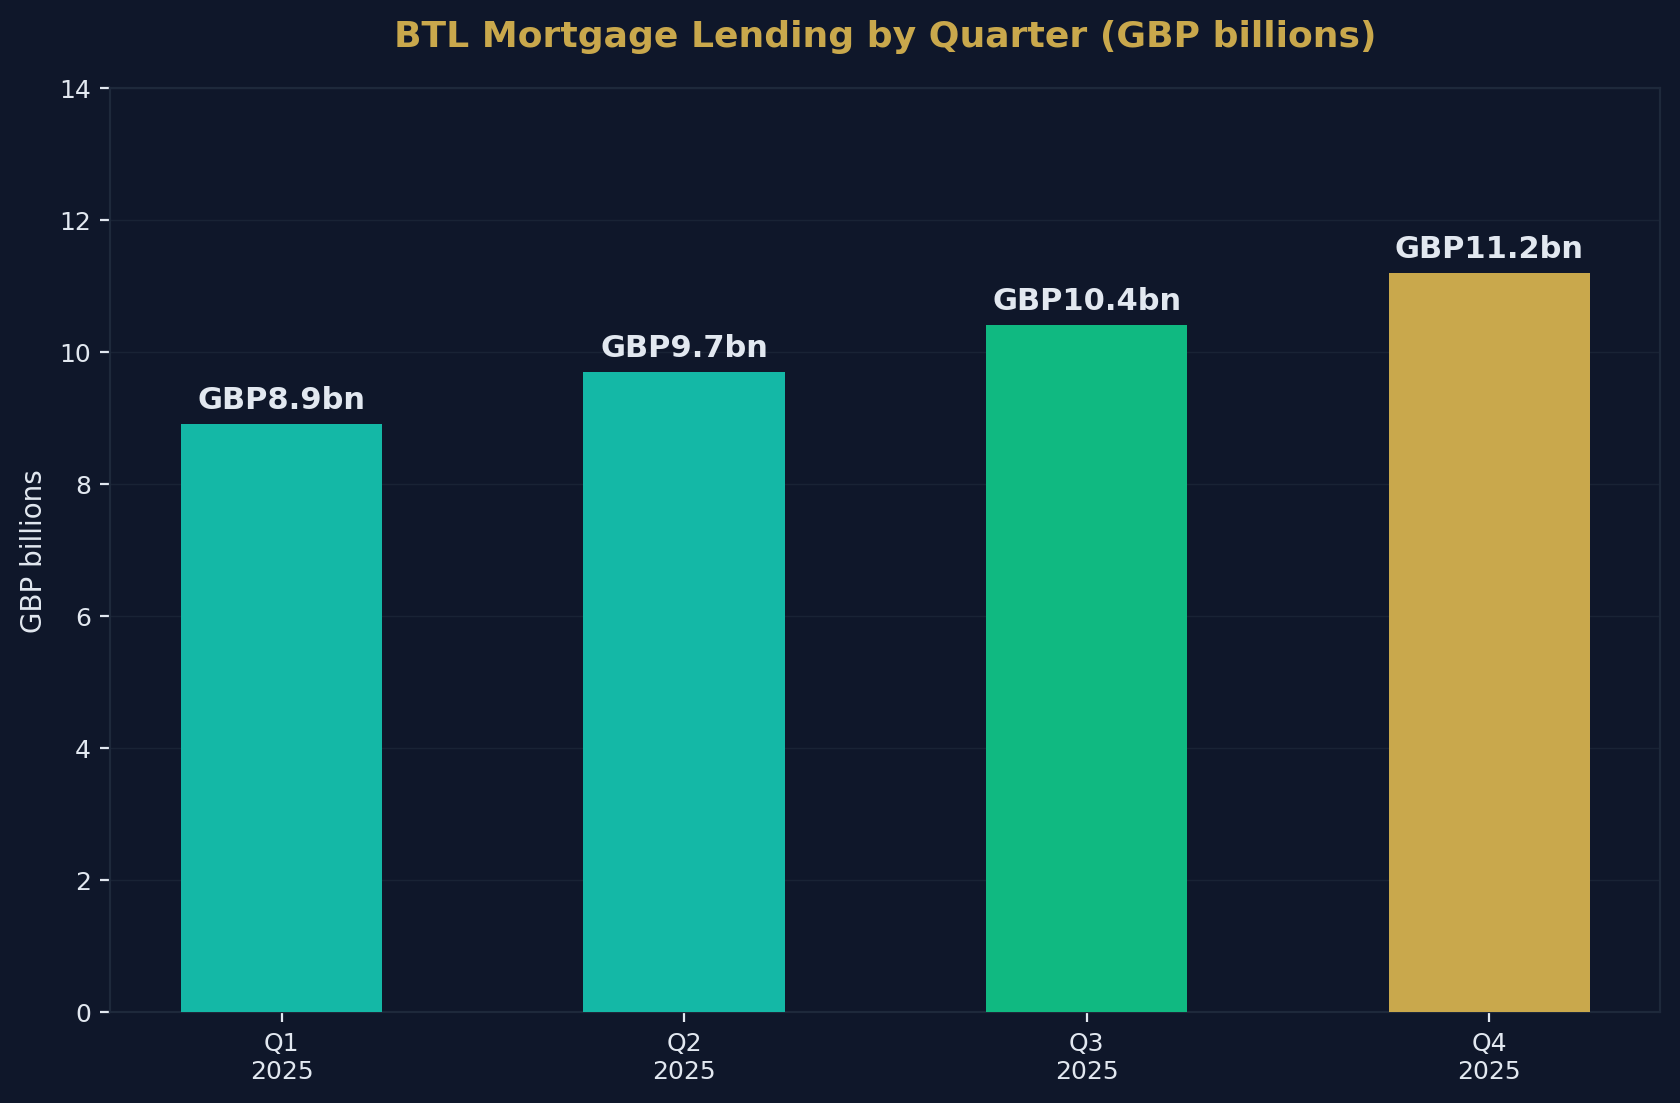
| Q1 2025 | 48,200 | £8.9bn | +15% |
| Q2 2025 | 52,300 | £9.7bn | +18% |
| Q3 2025 | 55,800 | £10.4bn | +21% |
| Q4 2025 | 59,489 | £11.2bn | +21.3% |
Outstanding BTL Mortgages
| Type | Count | YoY Change |
|---|---|---|
| Fixed-rate | 1,460,000 | +2.0% |
| Variable-rate | 466,000 | -9.8% |
| Total | ~1,926,000 | — |
BTL Mortgage Rates (April 2026)
| Product | Typical Rate |
|---|---|
| 2-year fixed (75% LTV, personal) | 3.73% |
| 5-year fixed (75% LTV, personal) | 4.0–4.5% |
| 5-year fixed (portfolio landlord) | 4.5–5.5% |
| Variable/tracker | 4.0–5.0% |
| Bridging finance | 0.55–0.95%/month |
Portfolio Health
| Metric | Figure |
|---|---|
| Average ICR | 218% |
| ICR 12 months ago | 201% |
| Arrears (>2.5%) | 9,520 mortgages |
| Arrears rate | ~0.5% |
The improving ICR (218% vs 201%) indicates that landlord cash flow is strengthening as rents rise and some mortgage rates stabilise. The extremely low arrears rate (0.5%) contradicts the narrative of widespread landlord distress.
Landlord Demographics
Who Are UK Landlords?
| Demographic | Data |
|---|---|
| Median age | 59 years |
| Aged 55+ | ~65–75% |
| Aged under 40 | <10% |
| Male | 55% |
| Female | 44% |
| Retired | >33% |
| Full-time landlord | ~15% |
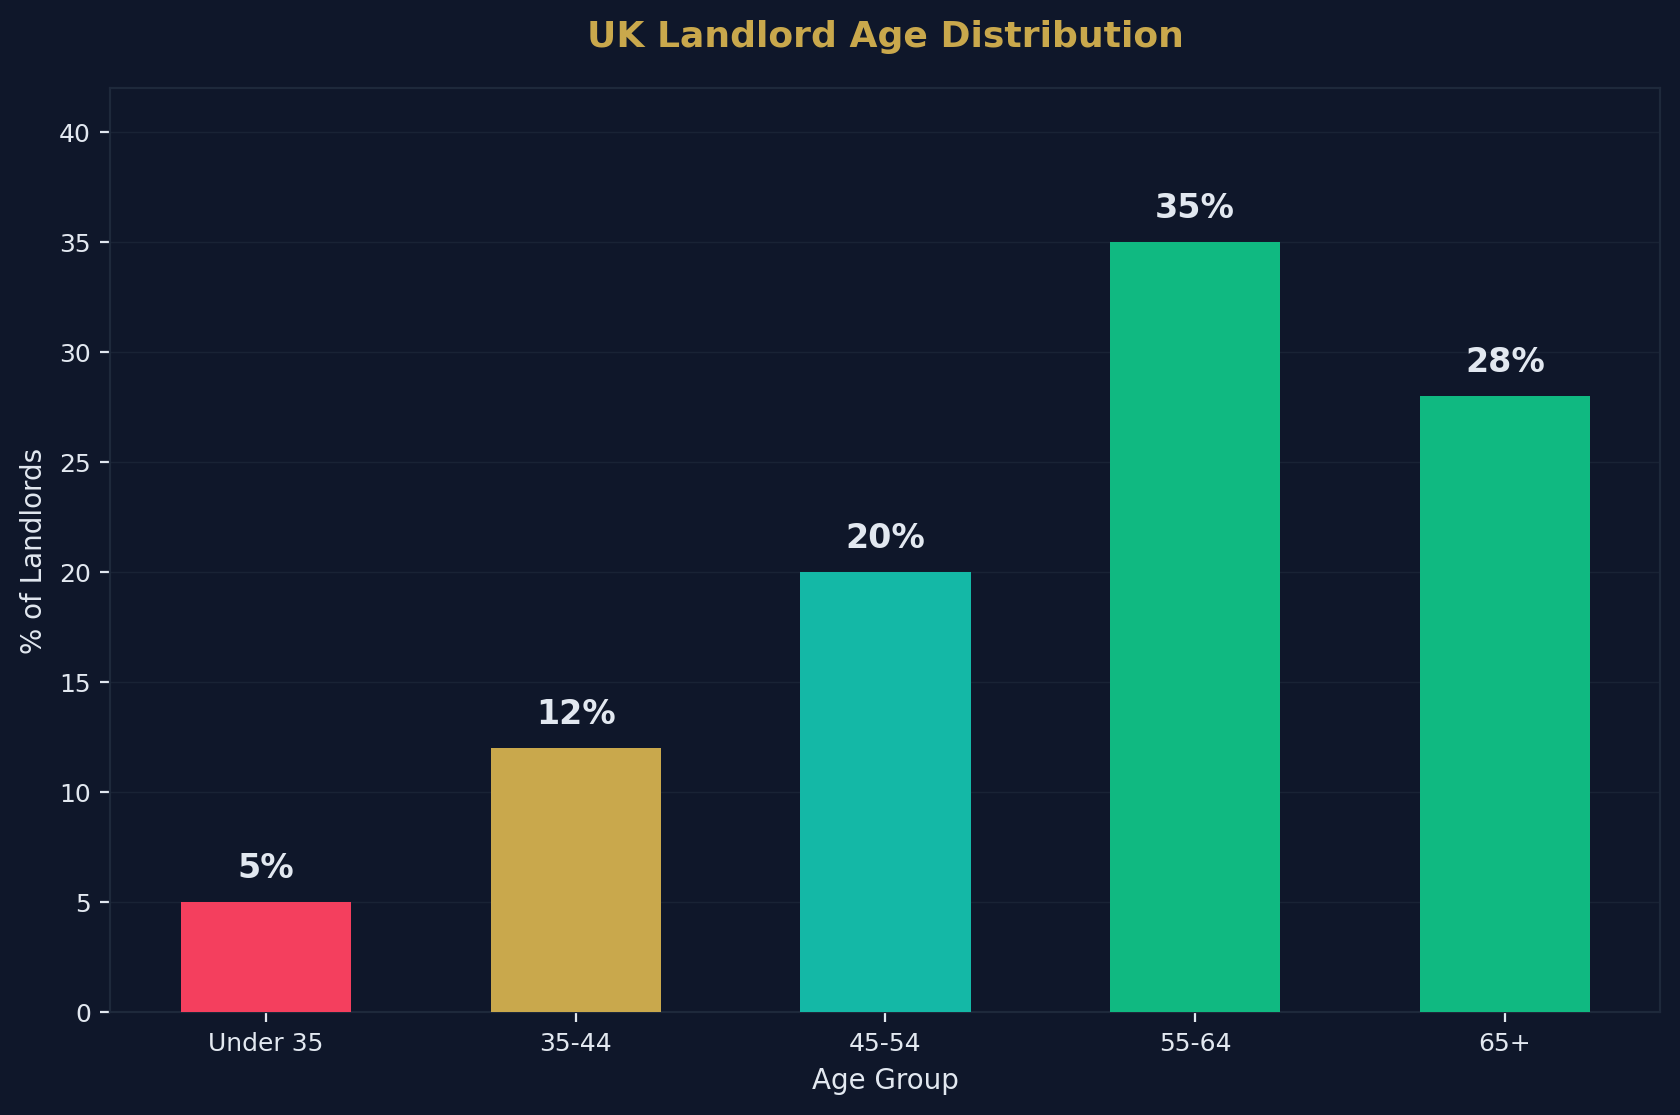
The Ageing Landlord Problem
The concentration of landlords in older age groups creates a medium-term succession risk for the sector:
- As landlords retire and sell, significant stock enters the market simultaneously
- Younger investors face higher barriers to entry (higher stamp duty, stricter lending, larger deposits)
- The gap is being filled by corporate and institutional investors rather than individual newcomers
Portfolio Size Distribution
How Many Properties Do Landlords Own?
| Portfolio Size | % of Landlords | Estimated Landlords |
|---|---|---|
| 1 property | 45% | ~990,000 |
| 2–4 properties | 38% | ~836,000 |
| 5–9 properties | 11% | ~242,000 |
| 10–24 properties | 4% | ~88,000 |
| 25+ properties | 2% | ~44,000 |
| Total | 100% | ~2,200,000 |
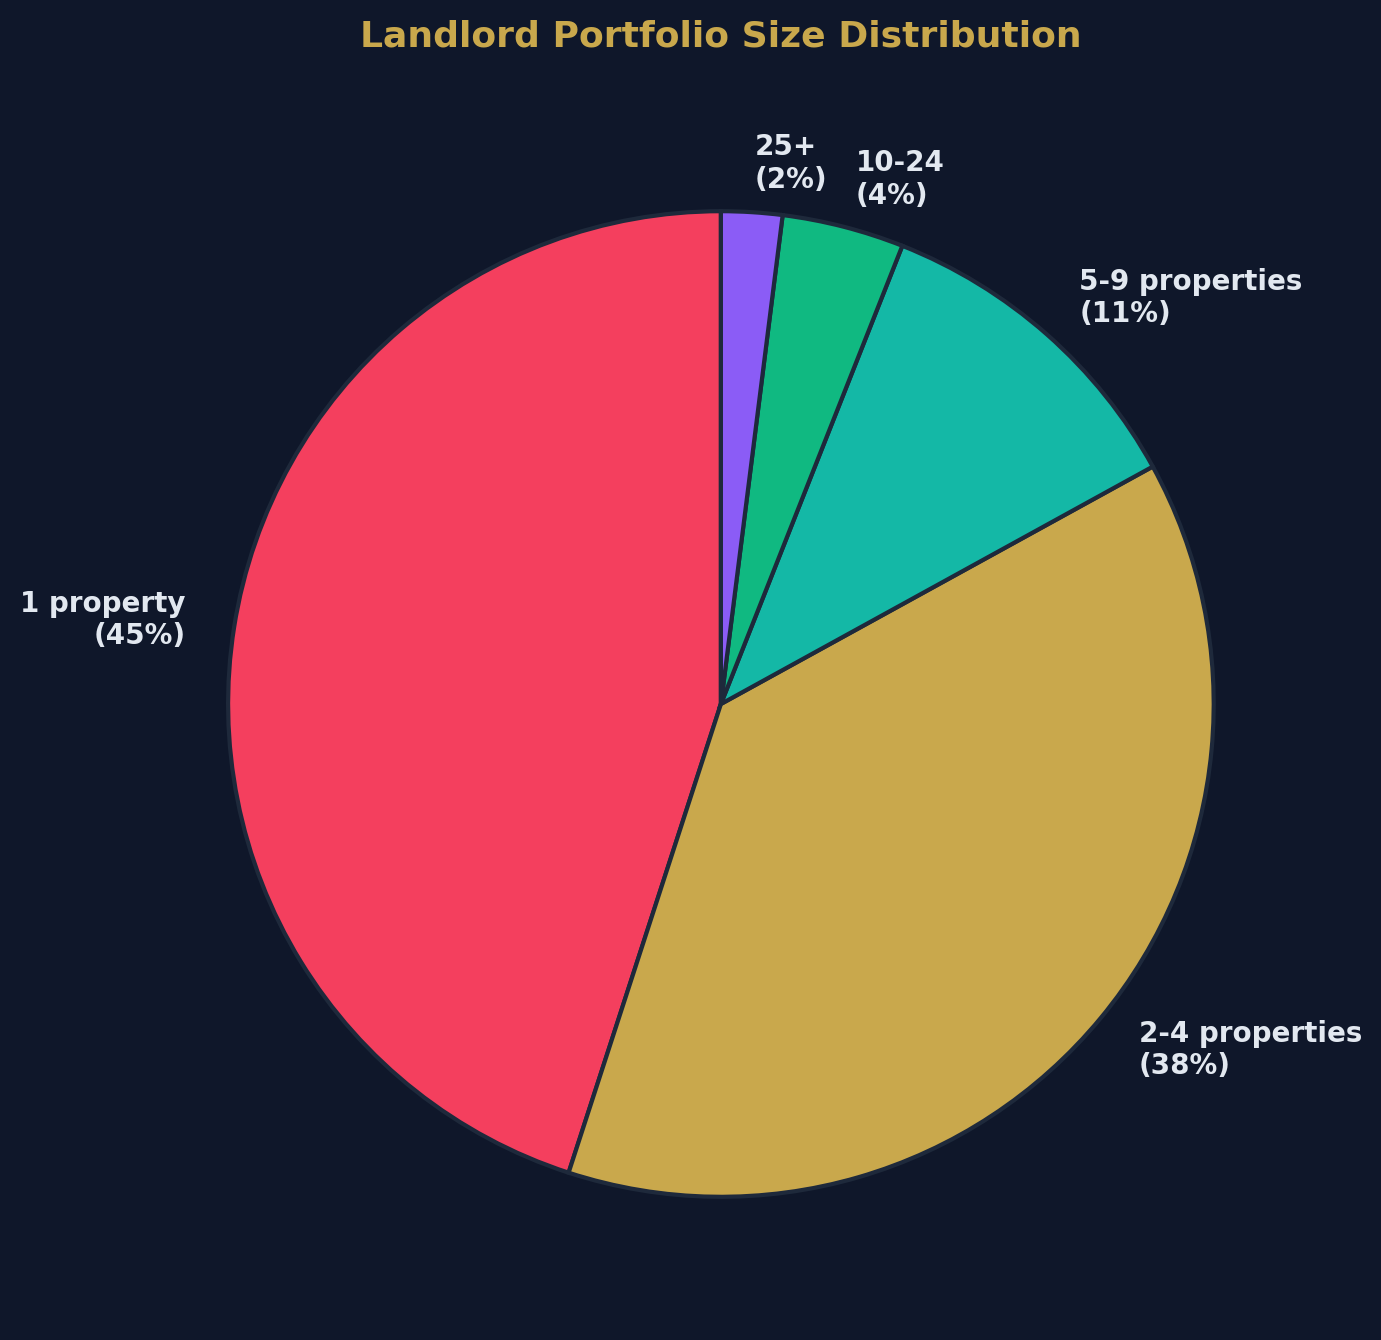
The Consolidation Trend
While single-property landlords dominate by number, the market is consolidating:
- Smaller landlords (1–4 properties) are more likely to exit
- Portfolio landlords (5+) are expanding, absorbing exiting stock
- Limited company structures make scaling portfolios more tax-efficient
- Professional property management enables larger portfolios
A growing share of these expanding portfolio landlords now buy through property sourcing companies rather than sourcing stock themselves.
The Limited Company Revolution
BTL Company Registrations
| Year | Active BTL Companies | New Companies (Annual) |
|---|---|---|
| 2016 | ~90,000 | — |
| 2018 | ~140,000 | ~25,000 |
| 2020 | ~210,000 | ~35,000 |
| 2022 | ~310,000 | ~50,000 |
| 2024 | ~400,000 | ~45,000 |
| 2025 | 443,272 | ~43,000 |
| Jan 2026 | — | 5,922 (monthly, +11% YoY) |
Why Limited Companies Dominate New Purchases
| Factor | Personal Landlord | Limited Company |
|---|---|---|
| Mortgage interest deduction | 20% basic rate tax credit only | Full deduction as business expense |
| Tax rate on profits | 20–45% income tax | 25% corporation tax |
| Retained earnings | Taxed as income when drawn | Can accumulate tax-free in company |
| Capital growth tax | 18–24% CGT | 25% corp tax + extraction tax |
| Inheritance planning | Direct estate liability | Shares can be transferred |
For higher-rate taxpayers, the limited company structure can improve after-tax returns by 15–30% compared to personal ownership — making it the rational default for any new acquisition.
The "Landlord Exodus" — Fact vs Fiction
What the Data Actually Shows
The media narrative of a "landlord exodus" is partially true but significantly oversimplified:
| Claim | Reality |
|---|---|
| "Landlords are leaving in droves" | PRS is contracting — but slowly (220,000 households over 2+ years, ~4.5% of total) |
| "BTL is dead" | BTL lending is UP 21% YoY; 59,489 new loans in Q4 2025 alone |
| "No one is buying BTL anymore" | 75–80% of new purchases via Ltd companies — structure changed, not demand |
| "Yields make it unviable" | Average ICR at 218%; most portfolios are profitable |
| "All landlords are selling" | Two-thirds plan growth activity in 2026 |
Who Is Actually Leaving
- Single-property accidental landlords who inherited or kept a property after moving
- Higher-rate personal taxpayers who refuse to restructure into limited companies
- Older landlords reaching retirement without succession plans
- Landlords with low-EPC properties who cannot justify upgrade costs
Who Is Entering/Expanding
- Limited company operators making tax-efficient acquisitions
- Portfolio landlords (5+ properties) absorbing exiting stock at discount
- Institutional investors via Build-to-Rent developments
- Professional deal packagers sourcing discounted stock for investor clients
Regulatory Timeline
Key Regulations Affecting BTL (2026–2030)
| Date | Regulation | Impact |
|---|---|---|
| April 2026 | Making Tax Digital (>£50k income) | Quarterly digital reporting required |
| April 2027 | MTD extended (>£30k income) | More landlords brought into scope |
| 2028 (est.) | Renters' Rights Act full implementation | End of Section 21; new compliance requirements |
| 2030 (est.) | EPC C minimum for all lettings | £5,000–£15,000 per property upgrade |
| Ongoing | Selective licensing expansion | £500–£800 per property per council |
EPC Compliance
| EPC Band | % of Rented Stock | Status |
|---|---|---|
| A–B | ~5% | Exceeds requirements |
| C | ~40% | Meets expected 2030 standard |
| D | ~35% | Upgrade needed by 2030 |
| E | ~15% | Current minimum — upgrade needed |
| F–G | ~5% | Non-compliant (unless exempt) |
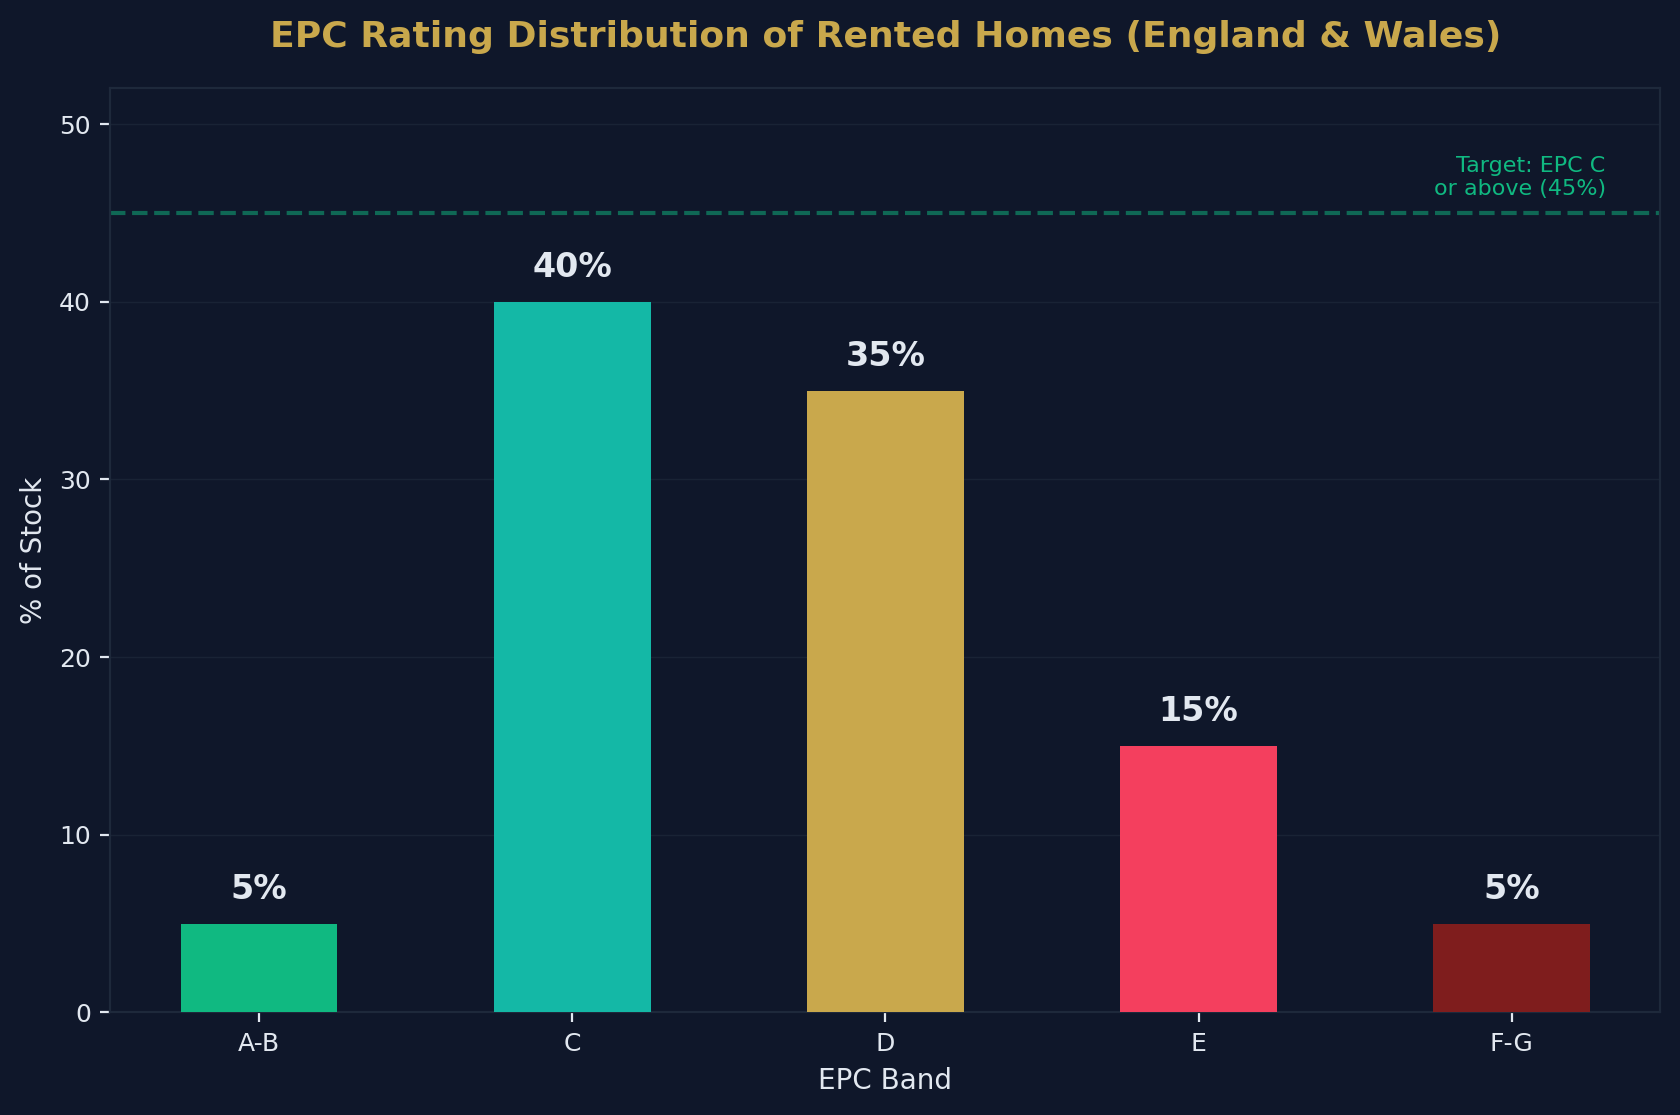
Approximately 55% of rented homes currently hold an EPC rating of D or below — representing a massive upgrade requirement if the EPC C target proceeds as planned.
Investment Returns: The Real Numbers
Average BTL Returns by Strategy
| Strategy | Gross Yield | Typical Net Yield | Capital Growth | Total Return |
|---|---|---|---|---|
| Single-let (North) | 6–8% | 3–4% | 2–4% | 5–8% |
| Single-let (South) | 3.5–5% | 1–2% | 3–5% | 4–7% |
| HMO (optimised) | 10–15% | 6–9% | 2–4% | 8–13% |
| Serviced accommodation | 8–15% | 4–8% | 2–4% | 6–12% |
| New-build flat | 4–6% | 1–3% | 3–5% | 4–8% |
10-Year BTL Investment Case
For a £200,000 property purchased via limited company with 75% LTV mortgage at 4.5%:
| Metric | Year 1 | Year 5 | Year 10 |
|---|---|---|---|
| Property value | £200,000 | £240,000 | £310,000 |
| Equity | £50,000 | £110,000 | £190,000 |
| Annual rent | £12,000 | £13,400 | £15,600 |
| Mortgage balance | £150,000 | £138,000 | £118,000 |
| Total return on cash invested | — | 120% | 280% |
Assumptions: 4% annual price growth, 2.5% annual rent growth, interest-only mortgage
Methodology and Data Sources
| Source | Data Type | Coverage |
|---|---|---|
| UK Finance | BTL lending, arrears, ICR | UK |
| ONS | Rents, private rental market | UK |
| Hamptons | Ltd company data, landlord trends | England & Wales |
| Companies House | BTL company registrations | UK |
| English Landlord Survey | Demographics, portfolio size | England |
| HMRC | Tax receipts, MTD | UK |
| Savills | Forecasts | UK |
How to Cite This Page
UK Buy-to-Let Statistics 2026. Shaded Canvas. Published April 2026, updated quarterly. Available at: https://blog.shadedcanvas.co.uk/post/uk-buy-to-let-statistics-2026
Stop being a landlord. Start being an investor.
Shaded Canvas introduces serious capital to vetted UK property opportunities — targeting 12–16% net returns.
Start Investing →