

Rental yield is the single most important metric for buy-to-let investors — and the UK's regional yield map has never been more polarised. This page consolidates every critical rental yield statistic for 2026, from gross and net yields by city and region to BTL lending trends, landlord demographics, and the structural forces shaping returns through to 2030.
Whether you are an investor evaluating your next acquisition, a mortgage broker advising landlord clients, or a researcher analysing the private rented sector, this is the definitive reference.
Last Updated: April 2026 | Next Update: July 2026
Key Rental Yield Statistics at a Glance
- The average UK gross yield for residential buy-to-let is approximately 5.5–6.0% in 2026.
- The average UK monthly private rent is £1,377 (ONS, 12 months to March 2026).
- England's average monthly rent is £1,434, Scotland's is £1,022, Wales's is £830.
- Rental inflation has decelerated to 3.4% nationally — down from 6%+ in 2023.
- The North East has the highest rental inflation at 6.5% year-on-year.
- London has the lowest rental inflation at 1.7% — an affordability ceiling effect.
- Hull offers the highest estimated gross yields at 8–11%.
- Liverpool yields range from 7–10%, driven by student demand and low entry prices.
- Bradford and Sunderland offer gross yields of 8–9.5%.
- London gross yields average just 3.5–4.5% — the lowest in the UK.
- HMOs (Houses in Multiple Occupation) achieve yields of 9–15% in optimal locations.
- Approximately 75–80% of all new BTL purchases are now made via a limited company.
- There are 443,272 active BTL companies registered at Companies House — nearly 5x the 2016 figure.
- BTL lending reached £6.6 billion in Q3 2025 — a 26% year-on-year increase.
- 39% of landlords planned to refinance in 2026 due to maturing fixed-rate deals.
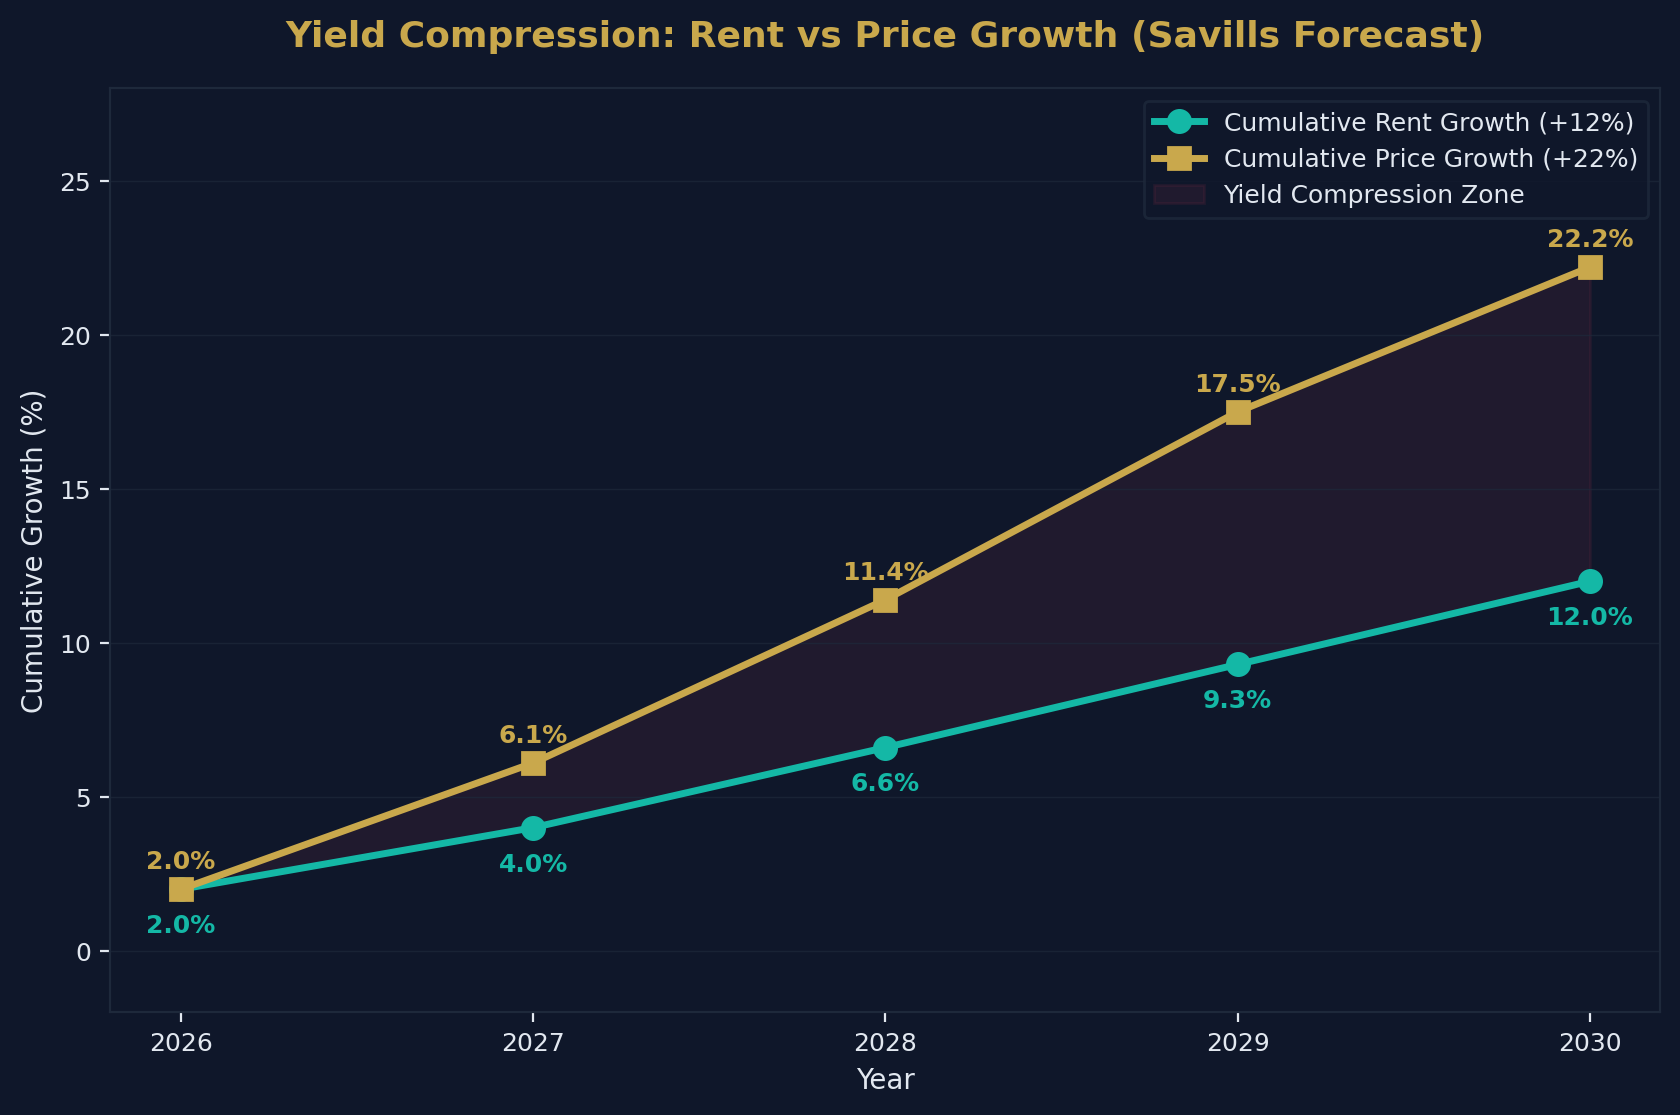
- Savills forecasts cumulative UK rental growth of 12% over 2026–2030.
Source: Shaded Canvas analysis of ONS, Hamptons, UK Finance, Companies House, Savills, and Zoopla data. Last updated April 2026. Cite as: "UK Rental Yield Statistics 2026, Shaded Canvas (blog.shadedcanvas.co.uk)."
Understanding Rental Yield
Before diving into the data, a brief clarification of the two yield metrics used throughout this article:
Gross Yield = (Annual Rental Income / Property Purchase Price) x 100
Net Yield = ((Annual Rental Income - Annual Costs) / Property Purchase Price) x 100
Annual costs typically include mortgage interest, maintenance, insurance, management fees, void periods, and landlord taxes. Net yield is always lower than gross yield — typically by 2–3 percentage points for a standard single-let property.
Throughout this article, unless otherwise stated, yield figures refer to gross yield.
Average Rent by Region
The ONS Private Rental Market Statistics for the 12 months to March 2026 show the following average monthly rents:
Average Monthly Rent by UK Nation
| Nation | Average Monthly Rent | Annual Change |
|---|---|---|
| England | £1,434 | +3.4% |
| Scotland | £1,022 | +2.1% |
| Northern Ireland | £880 | +5.0% |
| Wales | £830 | +4.8% |
| UK Average | £1,377 | +3.4% |
Rental Inflation by English Region
| Region | Annual Rental Inflation |
|---|---|
| North East | 6.5% |
| Yorkshire and the Humber | 5.2% |
| East Midlands | 4.8% |
| West Midlands | 4.5% |
| North West | 4.2% |
| South West | 3.8% |
| East of England | 3.2% |
| South East | 2.8% |
| London | 1.7% |
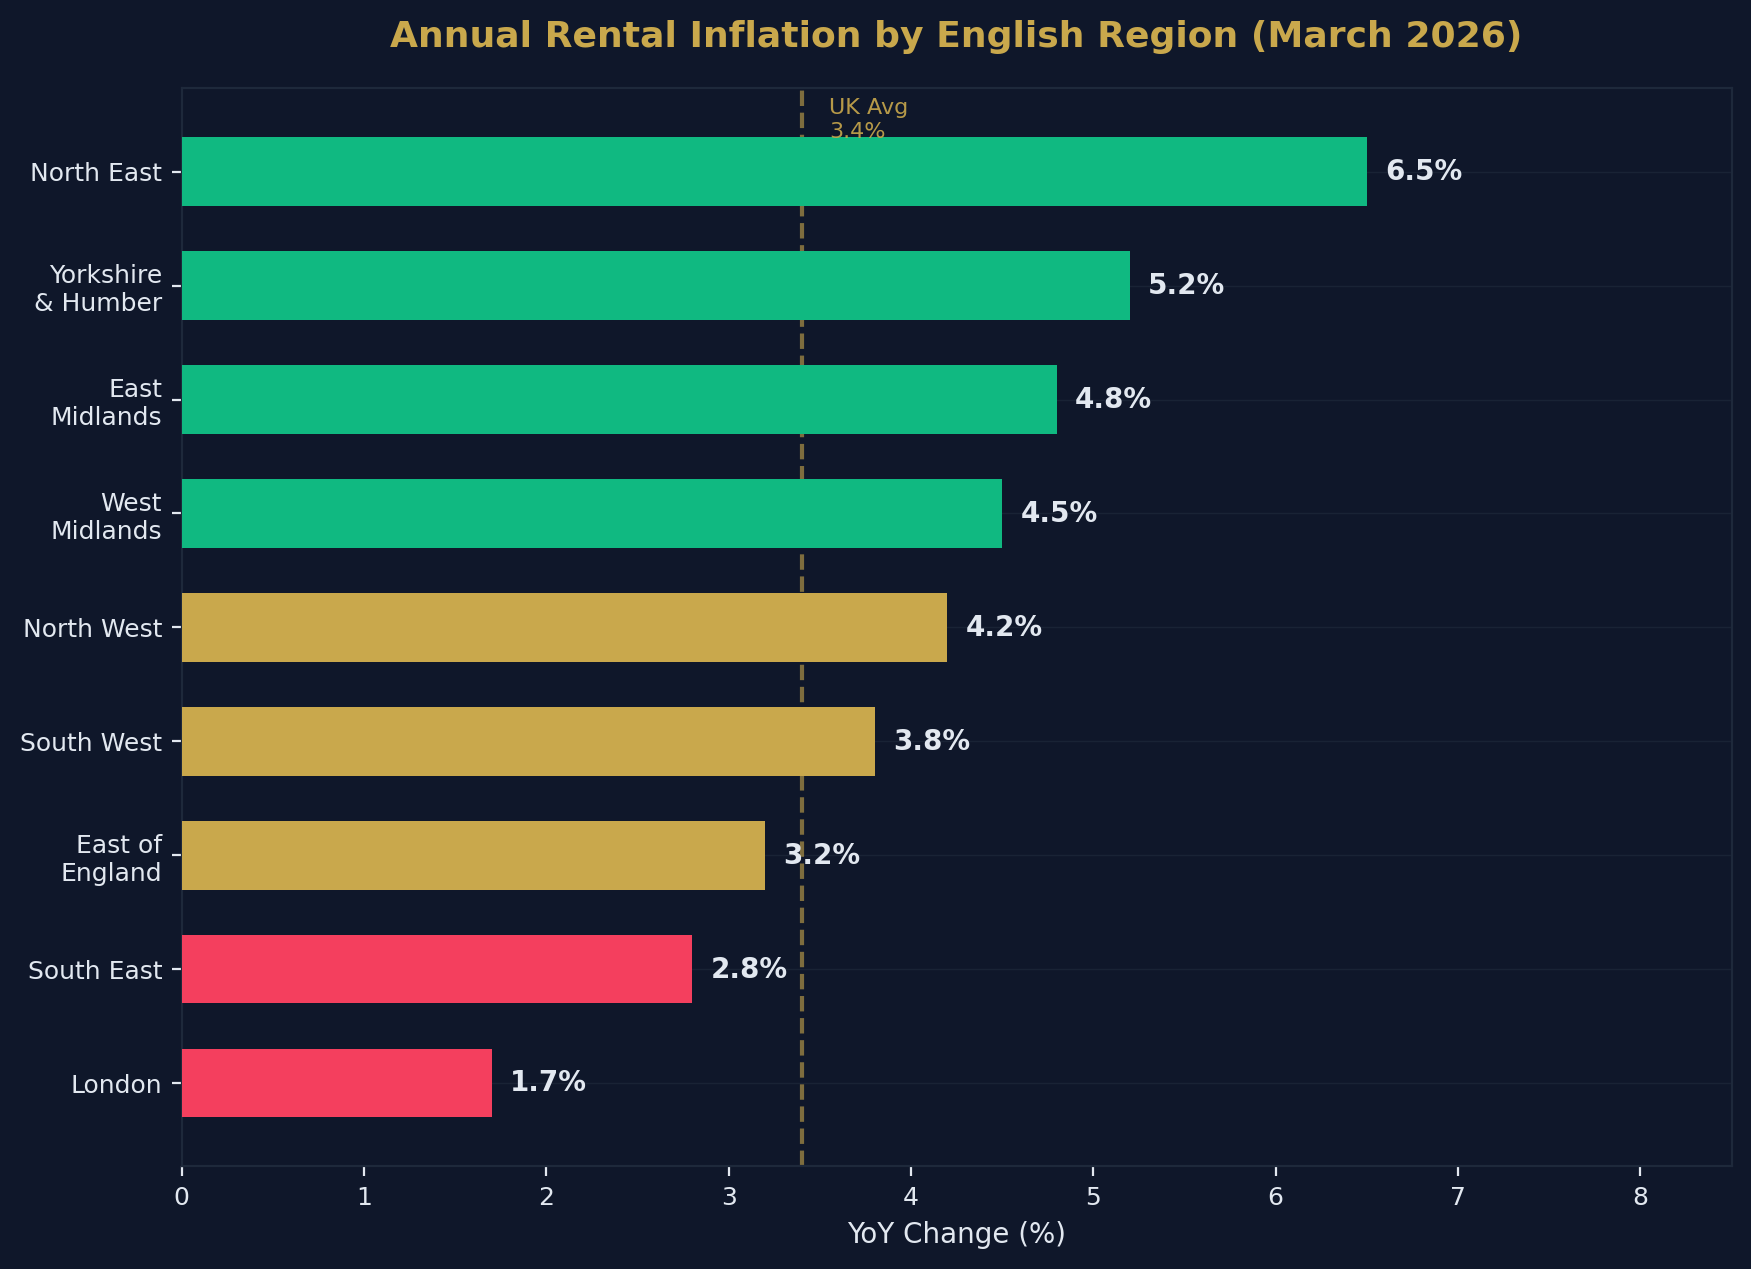
The inversion is striking: the regions with the lowest absolute rents (North East, Yorkshire) are experiencing the fastest rental growth, while London — the most expensive market — has the slowest. This reflects an affordability ceiling in London where tenants simply cannot absorb further increases, combined with stronger relative demand in northern cities where rents still represent a smaller share of income.
Gross Rental Yield by City
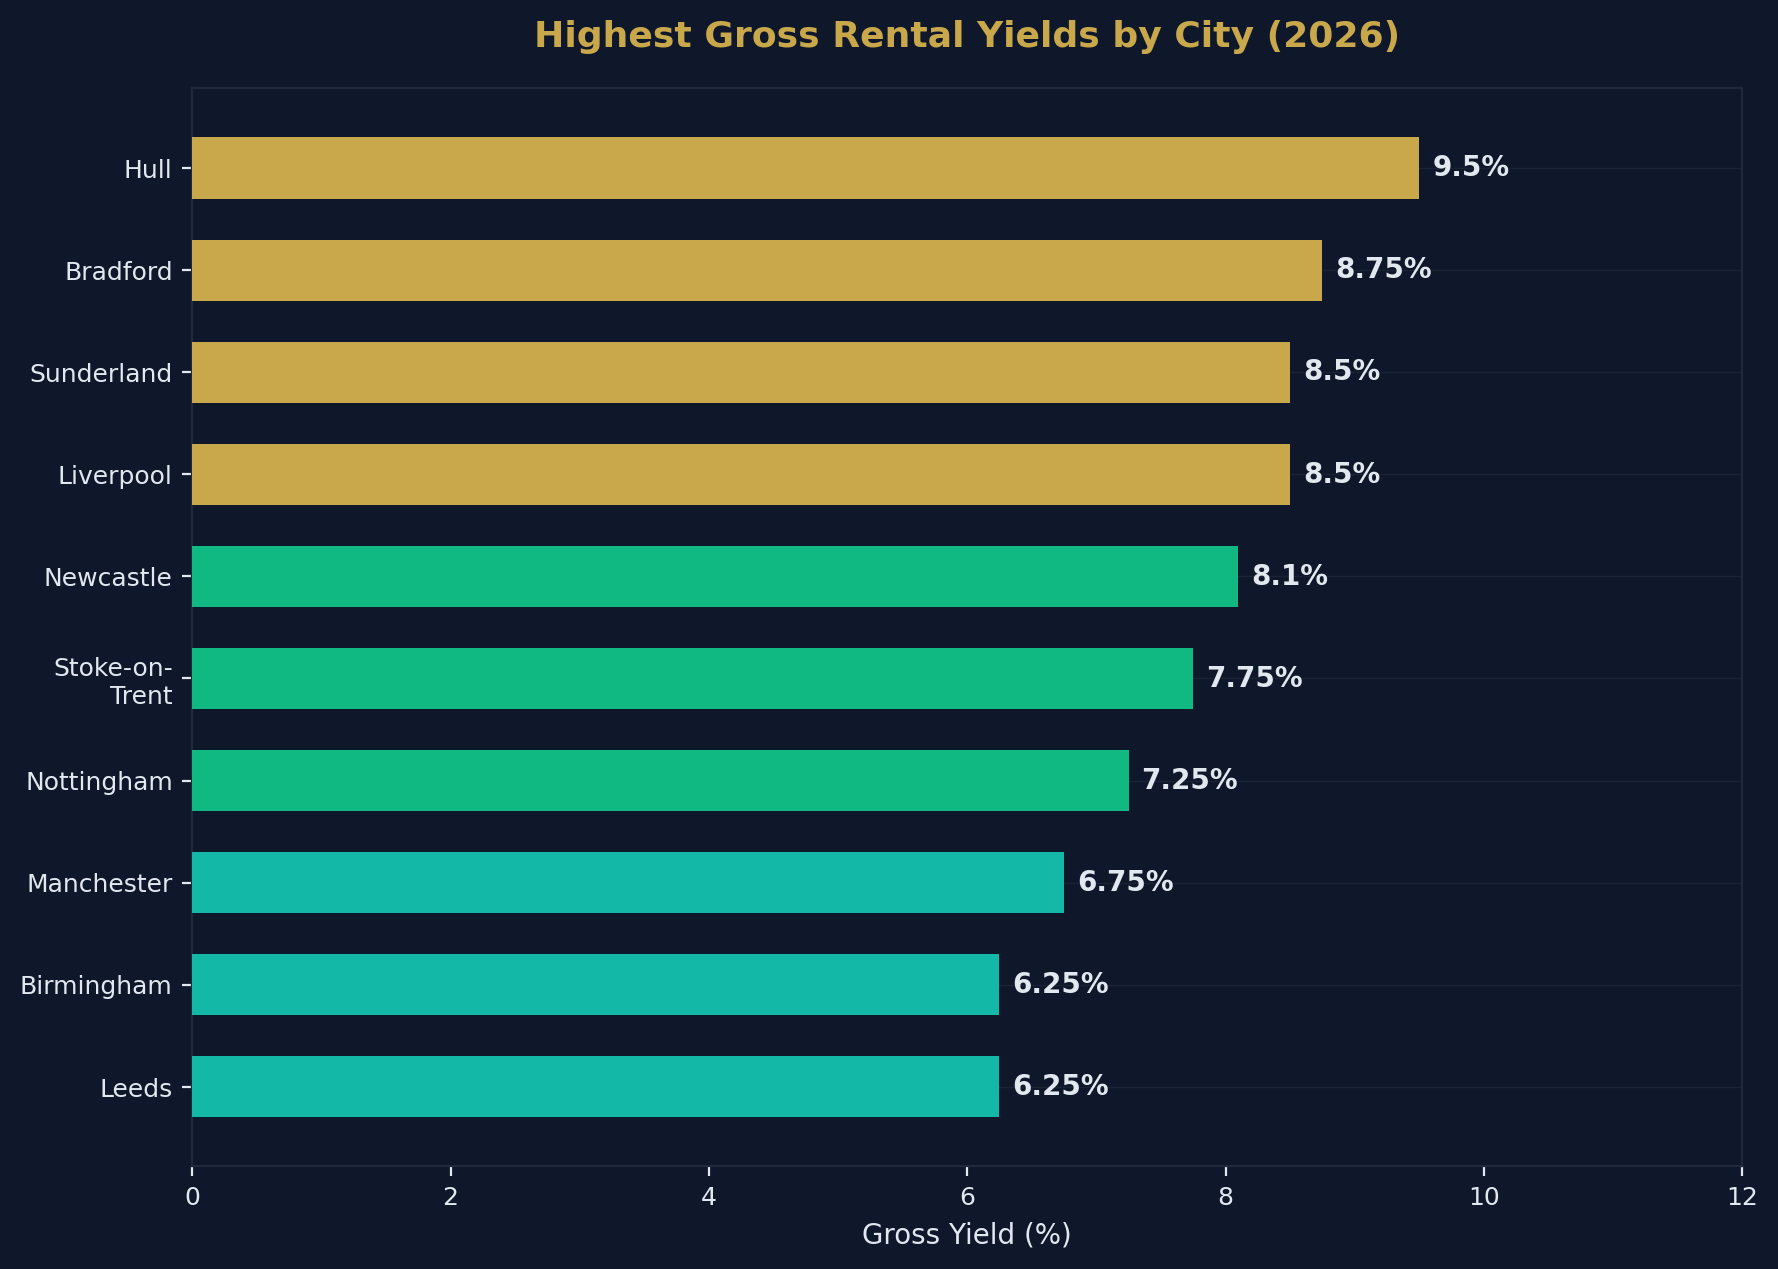
The yield map of the UK reveals a clear north-south divide. Cities with lower property prices consistently deliver higher gross yields, while expensive southern markets offer capital growth potential but inferior cash flow.
Highest-Yielding Cities (2026)
| City | Estimated Gross Yield | Average Property Price | Average Monthly Rent |
|---|---|---|---|
| Hull | 8.0–11.0% | £95,000–£120,000 | £550–£650 |
| Bradford | 8.0–9.5% | £100,000–£130,000 | £600–£700 |
| Sunderland | 8.0–9.0% | £90,000–£115,000 | £525–£625 |
| Liverpool | 7.0–10.0% | £120,000–£160,000 | £700–£850 |
| Newcastle | 6.5–9.7% | £130,000–£170,000 | £700–£850 |
| <a href="/post/property-investment-stoke-on-trent" style="color:#c9a84c;text-decoration:underline;font-weight:500">Stoke-on-Trent | 7.0–8.5% | £105,000–£135,000 | £575–£675 |
| Nottingham | 6.5–8.0% | £140,000–£180,000 | £750–£850 |
| <a href="/post/investment-property-manchester-uk" style="color:#c9a84c;text-decoration:underline;font-weight:500">Manchester | 6.0–7.5% | £180,000–£230,000 | £900–£1,100 |
| Birmingham | 5.5–7.0% | £170,000–£220,000 | £800–£950 |
| Leeds | 5.5–7.0% | £160,000–£210,000 | £750–£900 |
Lowest-Yielding Cities (2026)
| City | Estimated Gross Yield | Average Property Price |
|---|---|---|
| London (Prime Central) | 2.5–3.5% | £1,000,000+ |
| London (Outer) | 3.5–4.5% | £400,000–£600,000 |
| Oxford | 3.5–4.5% | £400,000–£500,000 |
| Cambridge | 3.5–4.5% | £400,000–£480,000 |
| Bath | 3.5–4.5% | £380,000–£450,000 |
| Brighton | 4.0–5.0% | £350,000–£420,000 |
Why Low-Price Cities Yield More
The mathematics is straightforward: if you buy a property for £100,000 and rent it for £600/month (£7,200/year), your gross yield is 7.2%. If you buy for £500,000 and rent it for £1,800/month (£21,600/year), your gross yield is only 4.3%.
Rents do not scale linearly with property prices. A property that costs five times more does not command five times the rent. This structural relationship is why yield-focused investors consistently target northern cities with low entry prices and strong tenant demand.
Yield by Property Type
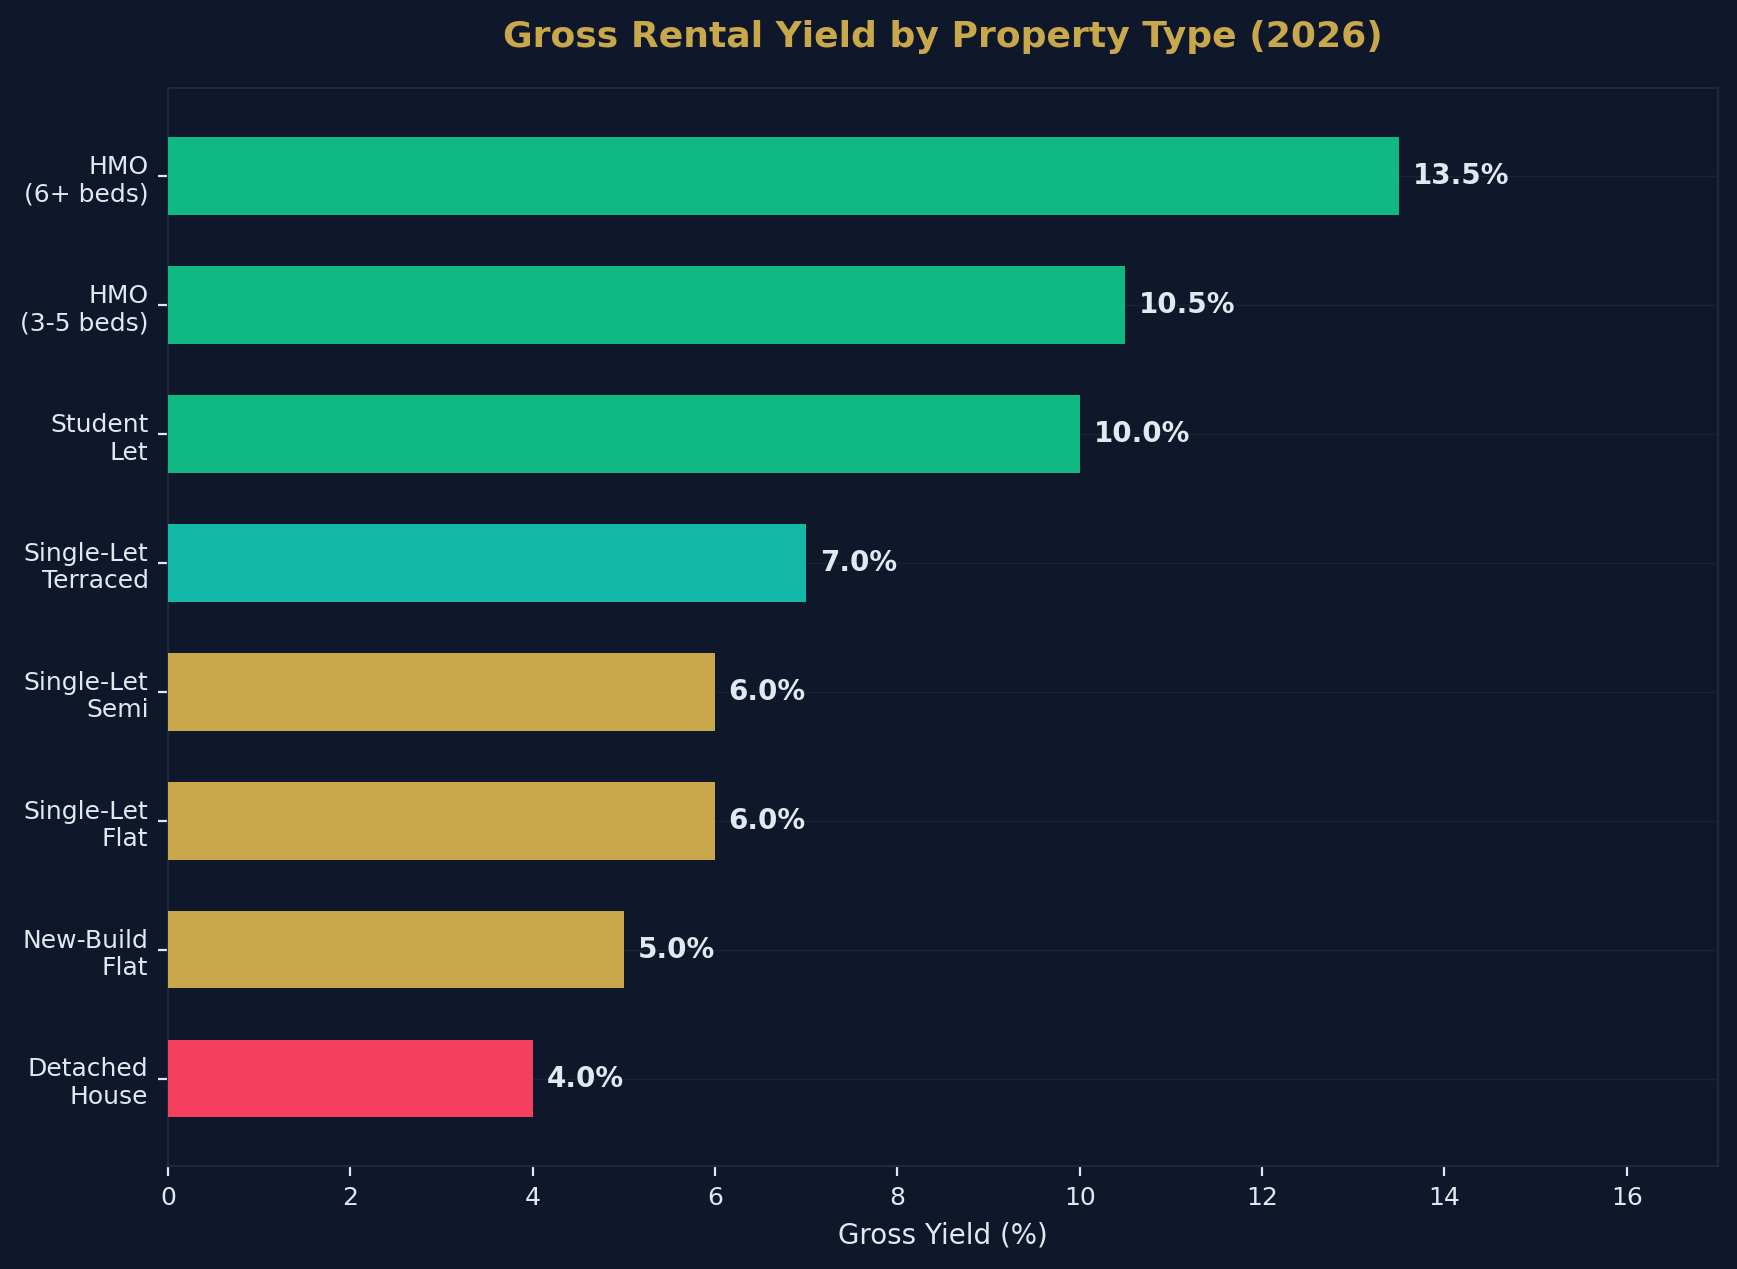
Not all property types deliver equal returns. The yield hierarchy in the UK market is consistent and well-documented:
Gross Yield by Property Type
| Property Type | Typical Gross Yield | Risk Level | Management Intensity |
|---|---|---|---|
| HMO (6+ beds) | 12–15% | High | Very High |
| HMO (3–5 beds) | 9–12% | Medium-High | High |
| Student Let | 8–12% | Medium | Medium-High |
| Serviced Accommodation | 8–15% (variable) | High | Very High |
| Single-Let Terraced | 6–8% | Low-Medium | Low |
| Single-Let Semi | 5–7% | Low | Low |
| Single-Let Flat | 5–7% | Low | Low-Medium |
| New-Build Flat | 4–6% | Low | Low |
| Detached House | 3–5% | Low | Low |
HMO Premium Explained
HMOs deliver higher yields because each room is let individually, creating multiple income streams from a single property. A 5-bedroom HMO rented at £500/room generates £2,500/month — significantly more than the same property would achieve as a single let (perhaps £1,000–£1,200/month).
However, HMO yields come with proportionally higher costs: licensing fees, more intensive management, higher maintenance, greater void risk per room, and compliance with additional regulations (fire safety, minimum room sizes, amenity standards).
The Buy-to-Let Market in Numbers
BTL Market Overview (2026)
| Metric | Figure |
|---|---|
| Private rented sector size | ~4.6 million households |
| Active BTL companies | 443,272 |
| New BTL companies (Jan 2026) | 5,922 (+11% YoY) |
| Properties in corporate structures | ~1.5 million |
| BTL titles in companies (E&W) | 755,000+ |
| New BTL purchases via Ltd company | 75–80% |
| BTL lending Q3 2025 | £6.6 billion (+26% YoY) |
| Landlords planning to refinance 2026 | 39% |
The Limited Company Revolution
The shift toward limited company ownership is the most significant structural change in the UK property investment market this decade. The numbers tell the story:
| Year | Active BTL Companies | Growth |
|---|---|---|
| 2016 | ~90,000 | — |
| 2018 | ~140,000 | +56% |
| 2020 | ~210,000 | +50% |
| 2022 | ~310,000 | +48% |
| 2024 | ~400,000 | +29% |
| 2025 | 443,272 | +11% |
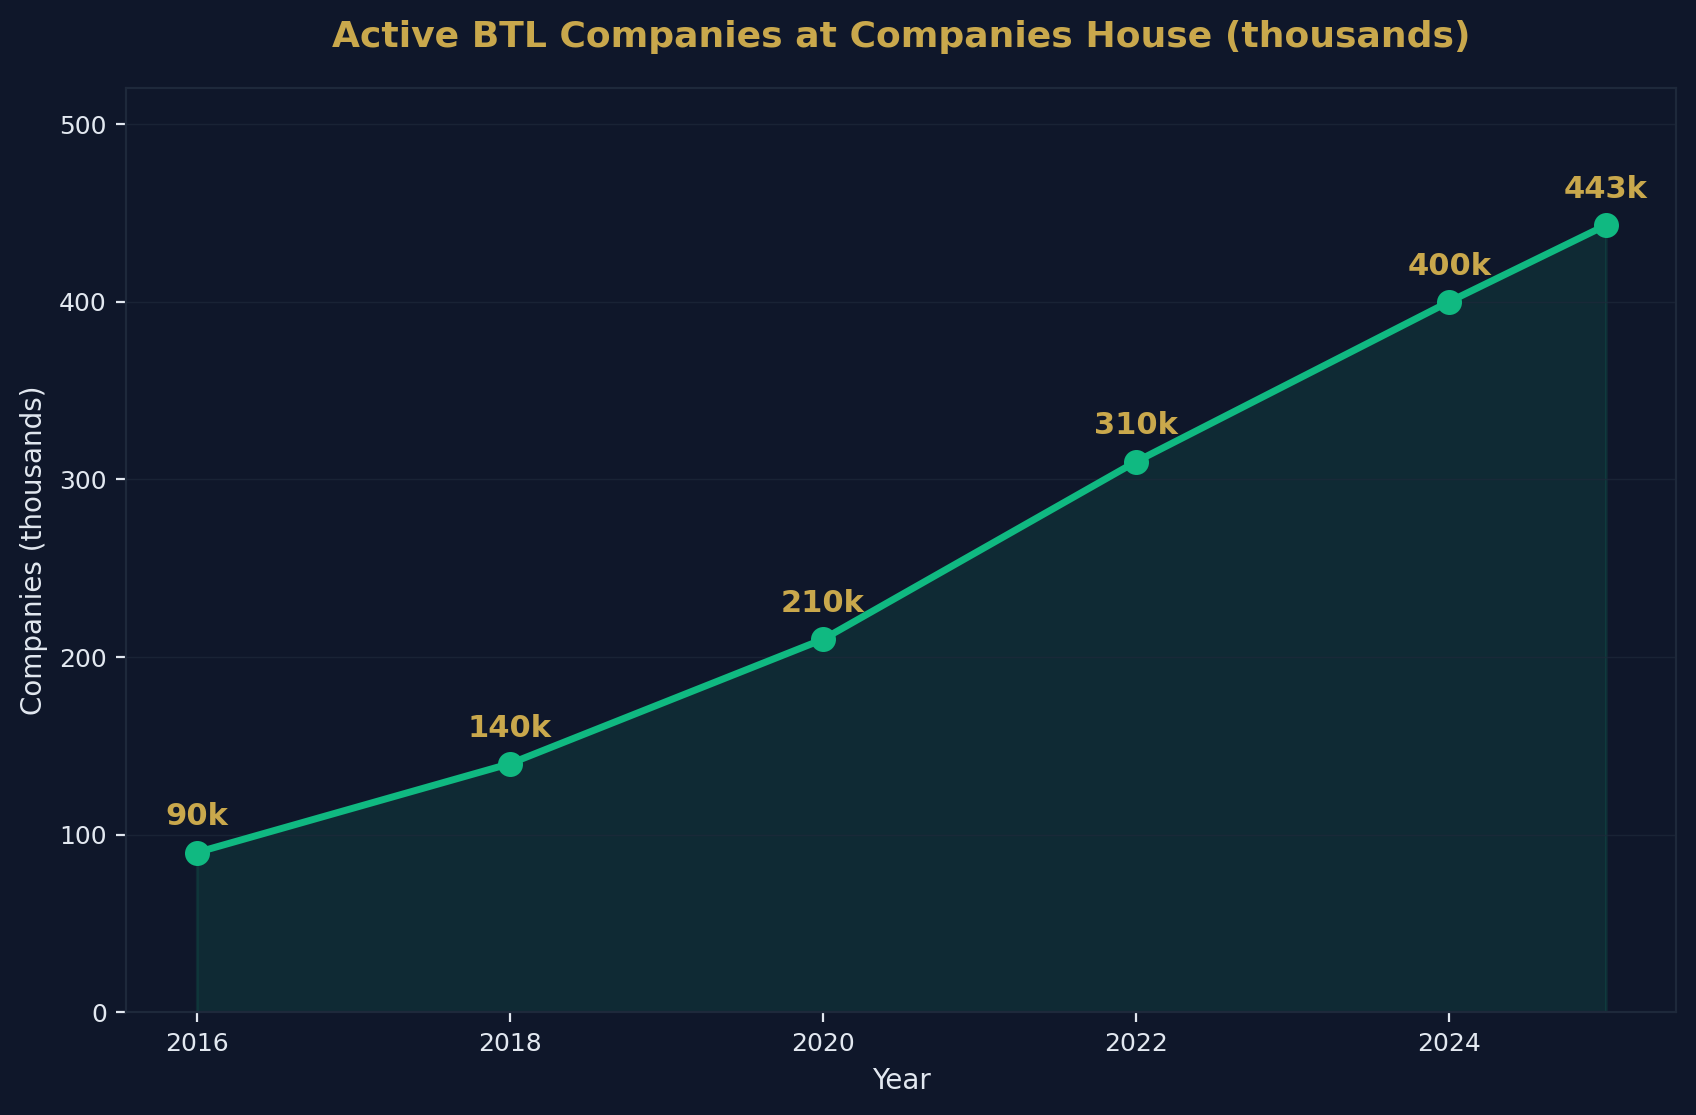
The driving forces behind this migration:
Section 24 tax relief restriction: Personal landlords can no longer deduct mortgage interest from rental income before calculating tax. Company landlords can. For higher-rate taxpayers, this creates a significant after-tax yield advantage.
Corporation tax vs income tax: Corporation tax is 25% vs up to 45% for personal income tax. Retained profits within a company accumulate more efficiently.
Mortgage interest deductibility: Companies can fully deduct mortgage interest as a business expense, restoring the pre-2017 tax position for new purchases.
BTL Mortgage Rates (April 2026)
| Product Type | Typical Rate Range |
|---|---|
| 2-year fixed (75% LTV, personal) | 4.5–5.5% |
| 5-year fixed (75% LTV, personal) | 4.2–5.2% |
| 5-year fixed (portfolio landlord) | 5.0–6.0% |
| Variable/tracker | 4.0–5.0% |
| Bridging finance | 0.55–0.95%/month |
Gross vs Net Yield: The Real Numbers
Gross yield is the headline figure, but net yield is what actually hits your bank account. Here is a realistic breakdown for a typical single-let BTL property:
Worked Example: £150,000 Property, £750/month Rent
| Item | Annual Amount |
|---|---|
| Gross Rental Income | £9,000 |
| Less: Mortgage interest (75% LTV, 5%) | -£5,625 |
| Less: Management fees (10%) | -£900 |
| Less: Maintenance/repairs | -£750 |
| Less: Insurance | -£300 |
| Less: Void periods (1 month) | -£750 |
| Less: Licensing/compliance | -£200 |
| Net Income (before tax) | £475 |
| Gross Yield | 6.0% |
| Net Yield (before tax) | 1.3% |
| Cash-on-Cash Return (on £37,500 deposit) | 1.3% |
This example illustrates why yield alone is an incomplete metric. At 6% gross, this property looks attractive. At 1.3% net, the cash flow barely covers unexpected costs. The investment case relies on capital appreciation and mortgage paydown — not rental income alone.
How to Improve Net Yield
- Negotiate purchase price: Every £10,000 below asking improves gross yield by ~0.4%
- Reduce mortgage cost: Moving from 5% to 4% interest saves £1,125/year on the example above
- Self-manage: Eliminating management fees adds £900/year
- Minimise voids: Retaining tenants avoids £750+ per void month
- Buy via limited company: Tax-efficient structure improves after-tax returns by 15–30%
Many yield-focused investors hand that negotiation to property sourcing agents who specialise in securing below-market purchase prices.
Rental Growth Forecast
Where are yields heading? The trajectory depends on the interplay between rent growth and price growth.
Savills Rental Growth Forecast (2026–2030)
| Year | Annual Rental Growth | Cumulative |
|---|---|---|
| 2026 | +2.0% | 2.0% |
| 2027 | +2.0% | 4.0% |
| 2028 | +2.5% | 6.6% |
| 2029 | +2.5% | 9.3% |
| 2030 | +2.5% | 12.0% |
Savills House Price Forecast (2026–2030)
| Year | Annual Price Growth | Cumulative |
|---|---|---|
| 2026 | +2.0% | 2.0% |
| 2027 | +4.0% | 6.1% |
| 2028 | +5.0% | 11.4% |
| 2029 | +5.5% | 17.5% |
| 2030 | +4.0% | 22.2% |
The Yield Compression Problem
When house prices grow faster than rents (as Savills projects from 2027 onwards), gross yields compress. A property yielding 6% today will yield closer to 5.5% by 2030 if prices grow 22% and rents grow only 12%.
For yield-focused investors, this means:
- Buy now while yields are high — the entry point matters more than timing
- Focus on areas where rent growth exceeds price growth — typically northern cities in the early cycle
- Prioritise value-add strategies (BRRRR, HMO conversion) that create yield through operational improvement rather than market movement
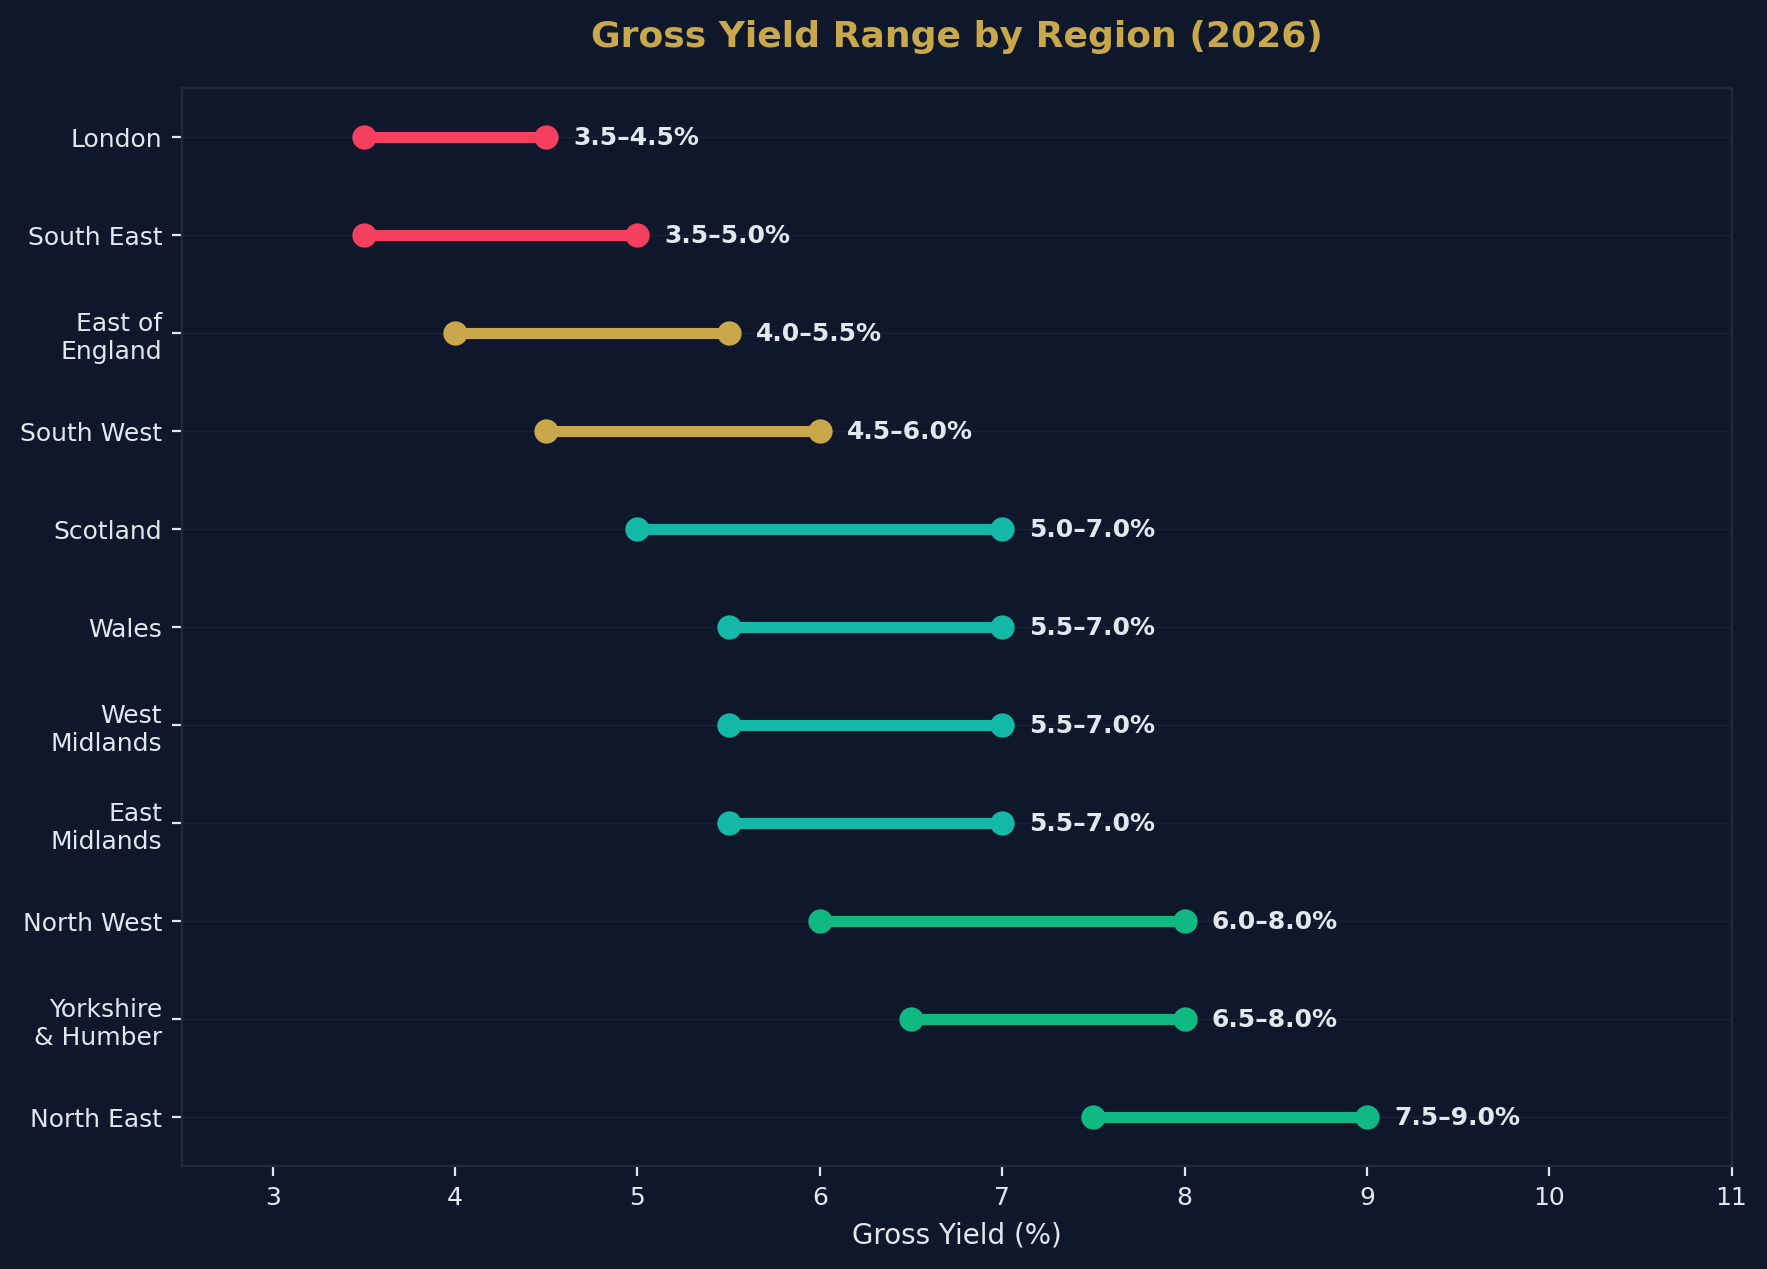
Regional Yield Map
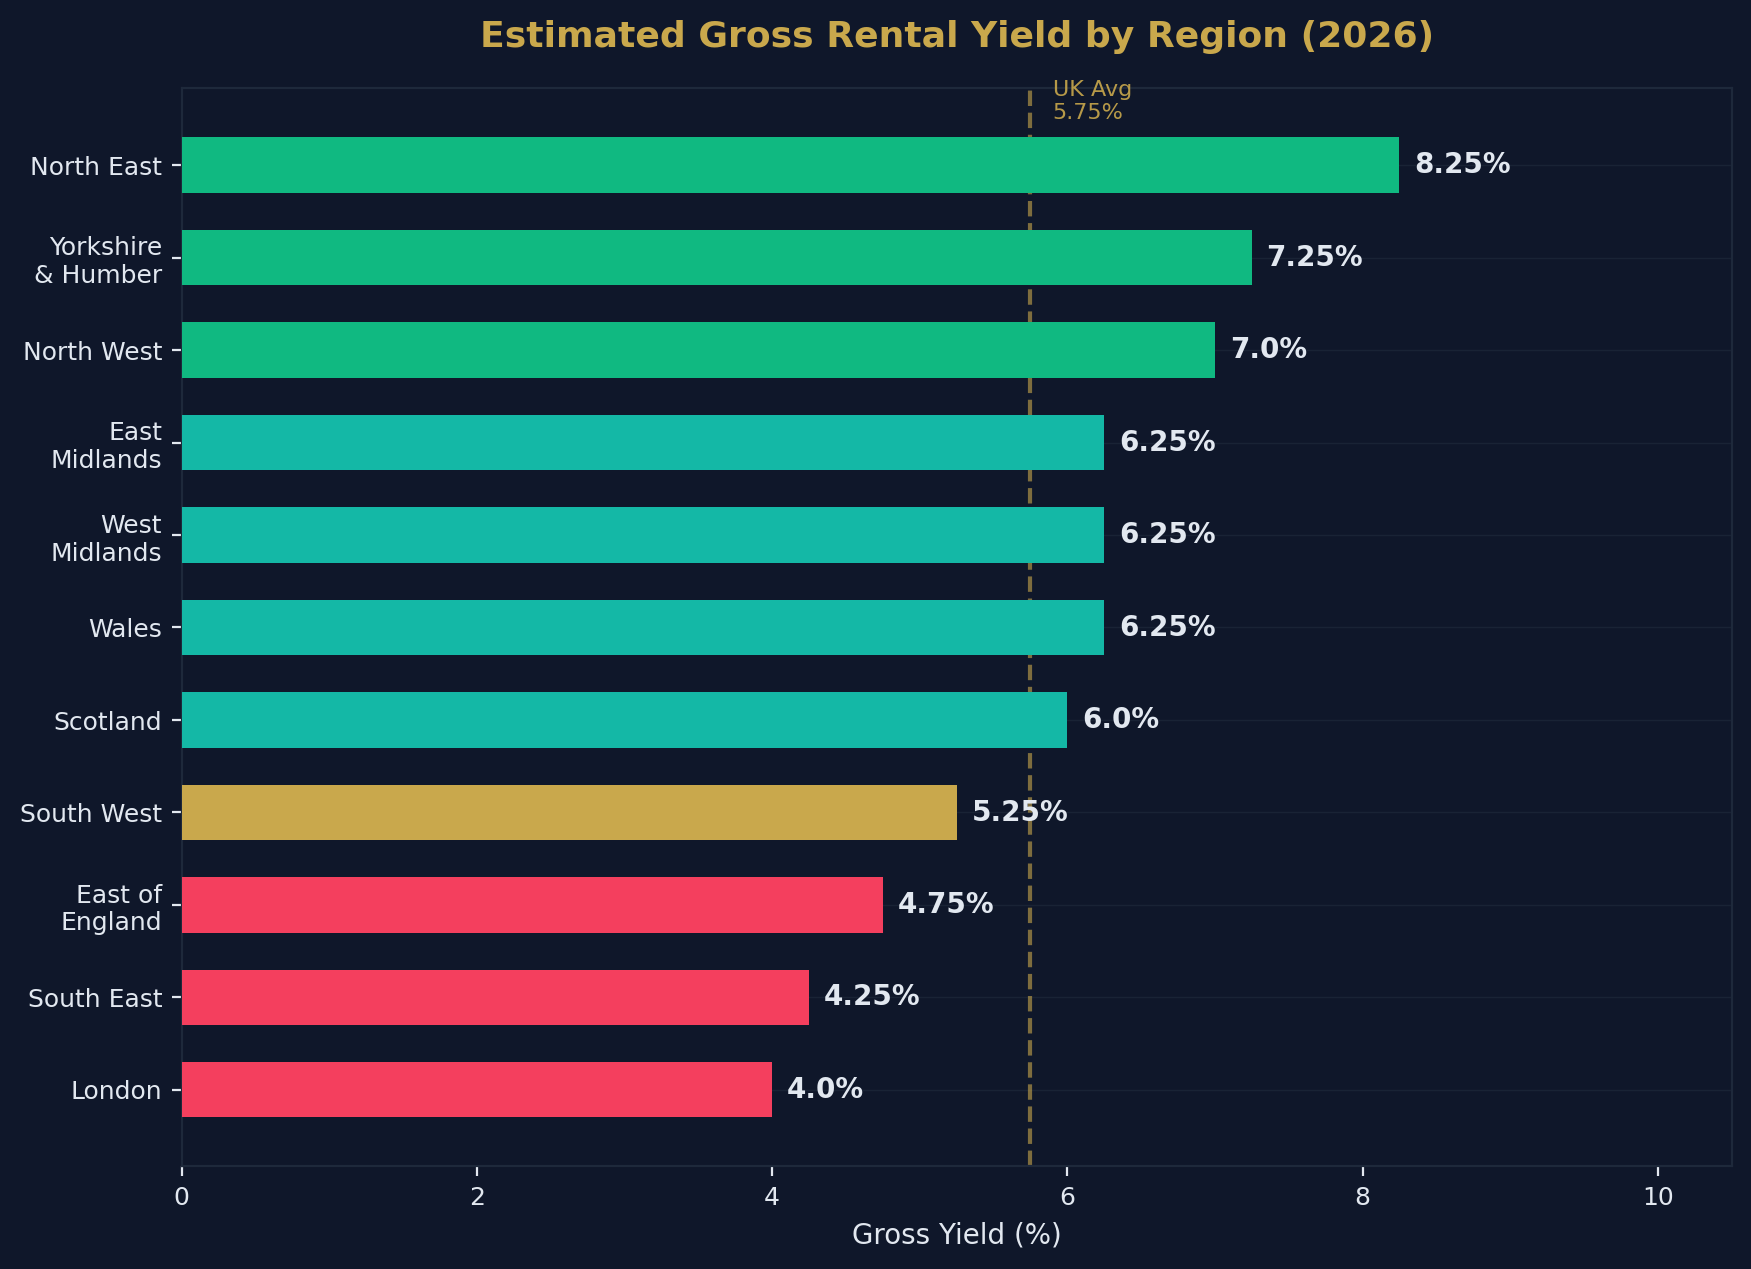
Estimated Gross Yield by English Region (2026)
| Region | Estimated Gross Yield | Avg Property Price | Avg Monthly Rent |
|---|---|---|---|
| North East | 7.5–9.0% | £120,000–£150,000 | £700–£800 |
| Yorkshire & Humber | 6.5–8.0% | £150,000–£190,000 | £750–£850 |
| North West | 6.0–8.0% | £160,000–£200,000 | £800–£950 |
| East Midlands | 5.5–7.0% | £180,000–£220,000 | £750–£850 |
| West Midlands | 5.5–7.0% | £180,000–£230,000 | £800–£900 |
| Wales | 5.5–7.0% | £160,000–£200,000 | £750–£850 |
| Scotland | 5.0–7.0% | £155,000–£200,000 | £800–£1,000 |
| South West | 4.5–6.0% | £250,000–£320,000 | £900–£1,100 |
| East of England | 4.0–5.5% | £280,000–£350,000 | £950–£1,100 |
| South East | 3.5–5.0% | £300,000–£400,000 | £1,000–£1,300 |
| London | 3.5–4.5% | £450,000–£650,000 | £1,500–£2,200 |
Landlord Regulatory Landscape
The regulatory environment significantly affects net yields. Key developments for 2026:
Current and Upcoming Regulations
| Regulation | Status | Yield Impact |
|---|---|---|
| Section 24 (mortgage interest restriction) | Fully implemented | -1 to -3% net yield for personal landlords |
| Renters' Rights Act | Enacted, phasing in | Increased compliance costs, potential void risk |
| EPC C minimum (rented homes) | Expected by 2030 | £5,000–£15,000 per property upgrade cost |
| Stamp Duty surcharge (additional properties) | 5% (from Oct 2024) | Higher entry cost, reduces effective yield |
| HMO licensing | Expanding | £500–£1,500 per licence, ongoing compliance |
| Selective licensing (councils) | Growing | Additional £500–£800 per property |
Impact on Landlord Behaviour
The cumulative effect of these regulations is accelerating the professionalisation of the sector:
- Smaller, accidental landlords are exiting — selling properties that often get absorbed by larger portfolio operators
- Limited company structures are becoming the default for new acquisitions
- Portfolio landlords (4+ properties) are expanding while single-property landlords contract
- Property management is increasingly outsourced to specialists
Methodology and Data Sources
| Source | Data Type | Coverage |
|---|---|---|
| ONS Private Rental Market Statistics | Rents, inflation | UK nations & regions |
| Zoopla Rental Market Report | Yields, demand metrics | UK cities & postcodes |
| Hamptons Monthly Lettings Index | Landlord trends, company data | England & Wales |
| UK Finance | BTL lending volumes, rates | UK financial institutions |
| Companies House | BTL company registrations | England & Wales |
| Savills | Rental forecasts (5-year) | UK & London |
| HMRC | SDLT data, landlord tax | England & NI |
How to Cite This Page
UK Rental Yield Statistics 2026. Shaded Canvas. Published April 2026, updated quarterly. Available at: https://blog.shadedcanvas.co.uk/post/uk-rental-yield-statistics-2026
Stop being a landlord. Start being an investor.
Shaded Canvas introduces serious capital to vetted UK property opportunities — targeting 12–16% net returns.
Start Investing →