The UK housing market is one of the most tracked economic sectors in the world — and one of the most data-rich. This page consolidates every critical housing market statistic for 2026, from average house prices and transaction volumes to tenure breakdowns, regional performance, and the structural forces shaping the market.
Whether you are a buyer timing your purchase, an investor analysing market conditions, or a researcher tracking housing policy, this is the definitive reference.
Last Updated: April 2026 | Next Update: July 2026
Key Housing Market Statistics at a Glance
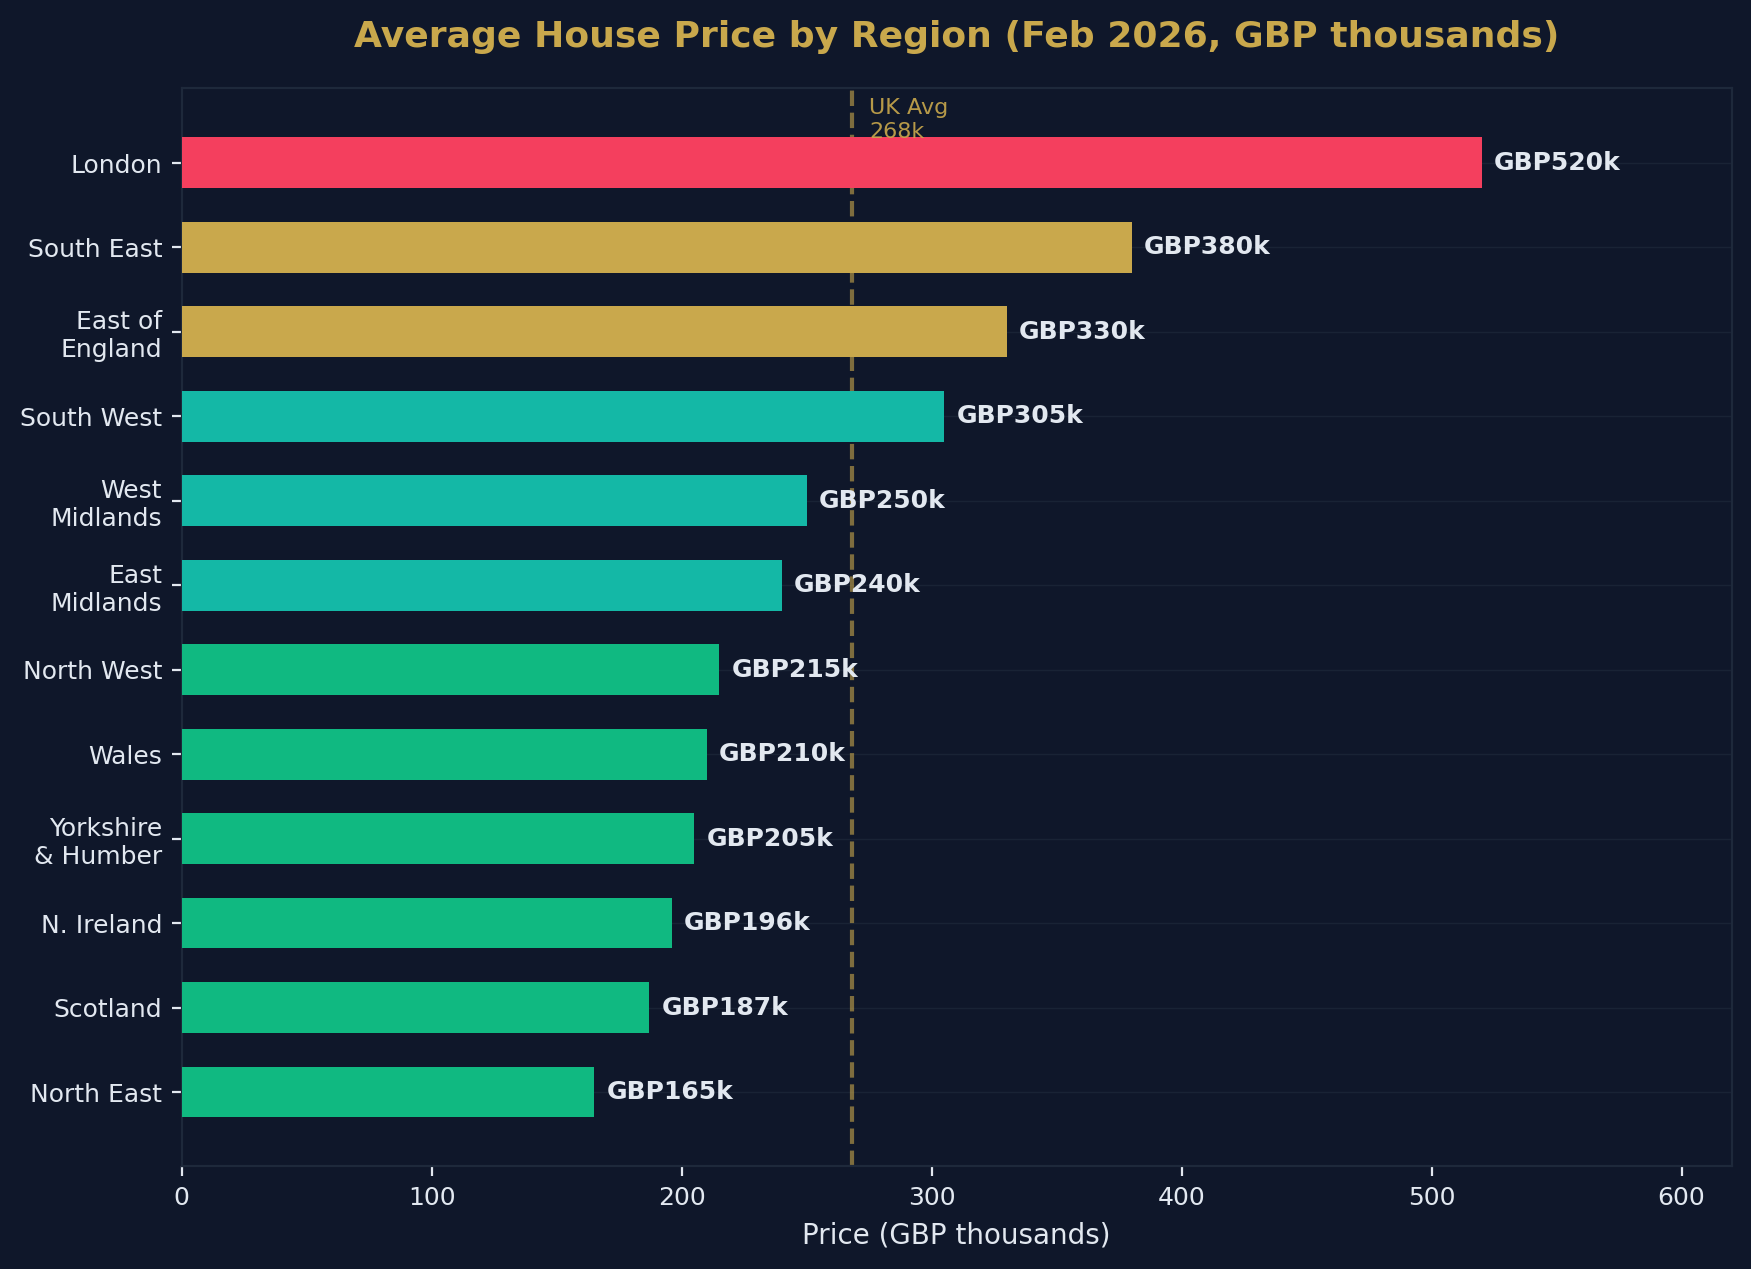
- The average UK house price is £268,000 (ONS/Land Registry, February 2026).
- Annual house price growth is +1.2% nationally.
- The average house price in England is £290,000, Scotland £187,000, Wales £210,000, Northern Ireland £196,000.
- Yorkshire and the Humber has the highest annual price growth in England at +3.9%.
- London recorded the weakest performance at -3.3% year-on-year.
- HMRC recorded 102,410 residential transactions in February 2026 (seasonally adjusted).
- Annual transaction volumes are running at approximately 1.2 million completions.
- The UK homeownership rate is approximately 64.5%.
- The private rented sector accounts for approximately 19% of households — and is contracting.
- Social housing accounts for approximately 16% of total housing stock in England.
- An estimated 220,000 households will exit the private rented sector by end of 2026.
- Average UK monthly private rent is £1,377 (ONS, March 2026).
- Annual rental inflation has cooled to 3.4% — the lowest since March 2022.
- Net housing additions stand at approximately 208,600 per year — well below the 300,000 government target.
- 68% of 23-year-olds still live with their parents — three times higher than a decade ago.
- Savills forecasts cumulative house price growth of 22.2% by 2030.
Source: Shaded Canvas analysis of ONS, HM Land Registry, HMRC, DLUHC, and English Housing Survey data. Last updated April 2026.
Average House Prices by Region
UK Nations (February 2026)
| Country | Average Price | Annual Change |
|---|---|---|
| England | £290,000 | +0.8% |
| Wales | £210,000 | +2.5% |
| Northern Ireland | £196,000 | +7.5% |
| Scotland | £187,000 | +2.3% |
| UK Average | £268,000 | +1.2% |
English Regions (February 2026)
| Region | Approximate Avg Price | Annual Change |
|---|---|---|
| London | £520,000 | -3.3% |
| South East | £380,000 | -0.5% |
| East of England | £330,000 | +0.3% |
| South West | £305,000 | +1.5% |
| West Midlands | £250,000 | +2.8% |
| East Midlands | £240,000 | +2.5% |
| North West | £215,000 | +3.2% |
| Yorkshire & Humber | £205,000 | +3.9% |
| North East | £165,000 | +3.5% |
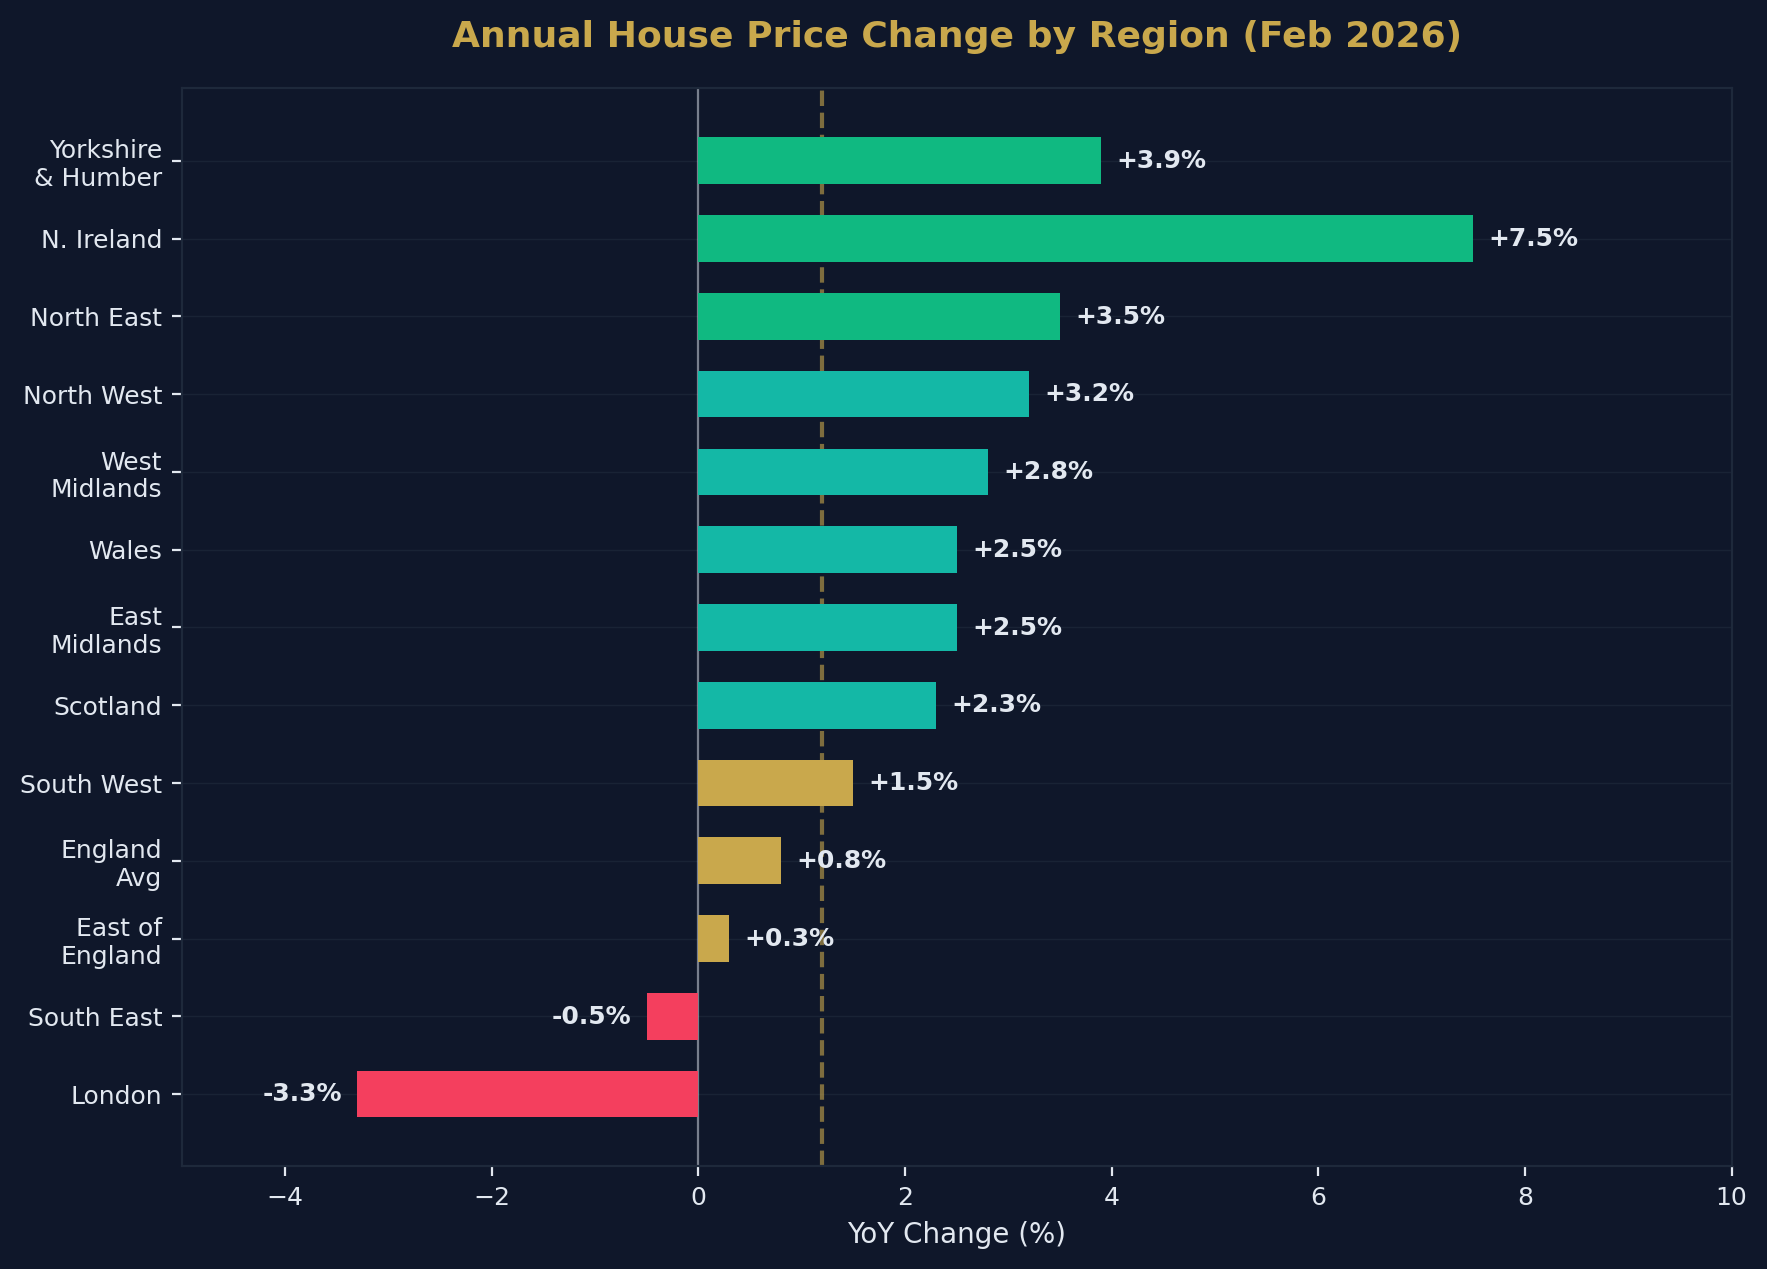
The North-South Inversion
For the first time in a decade, northern regions are outperforming southern England by a significant margin. Yorkshire's +3.9% growth vs London's -3.3% represents a 7.2 percentage point gap — the widest regional divergence since the post-financial crisis recovery.
The drivers:
- Affordability constraints in the South: London's price-to-earnings ratio exceeds 12x, creating a ceiling on further growth
- Remote working migration: Buyers relocating from London and the South East to more affordable regions
- Investor rotation: Buy-to-let investors targeting northern cities for superior rental yields (7–10% vs 3.5–4.5% in London)
- Infrastructure investment: HS2, Northern Powerhouse, and regional regeneration projects boosting confidence
The same regional divergence explains why many London-based investors now buy through a deal sourcing company with coverage in the North rather than searching remotely.
Transaction Volumes
Monthly Residential Transactions (Seasonally Adjusted)
| Month | Transactions |
|---|---|
| October 2025 | 98,450 |
| November 2025 | 100,350 |
| December 2025 | 100,440 |
| January 2026 | 96,940 |
| February 2026 | 102,410 |
Annual Transaction Trends
| Year | Estimated Annual Transactions | Change |
|---|---|---|
| 2019 | 1,180,000 | — |
| 2020 | 1,040,000 | -12% (COVID) |
| 2021 | 1,470,000 | +41% (stamp duty holiday) |
| 2022 | 1,230,000 | -16% |
| 2023 | 1,020,000 | -17% |
| 2024 | 1,100,000 | +8% |
| 2025 | 1,210,000 (est.) | +10% |
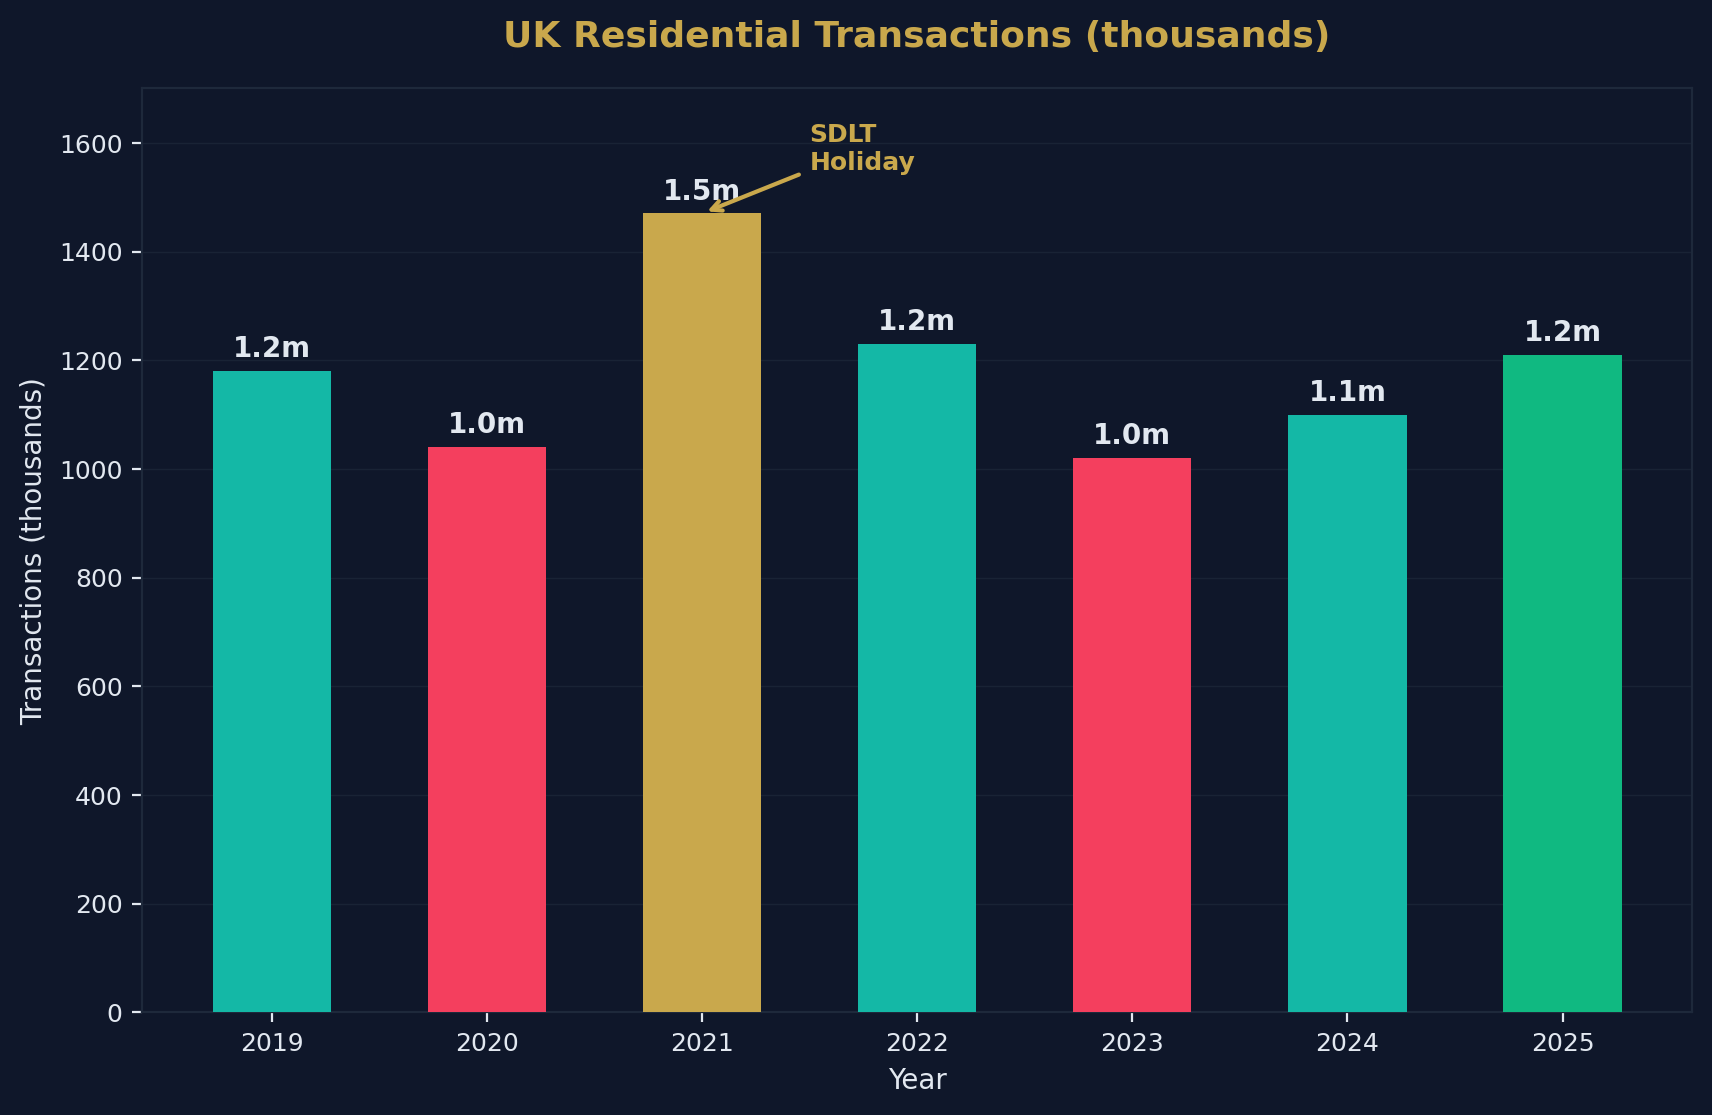
The 2021 spike (+41%) was entirely driven by the stamp duty holiday. The subsequent correction in 2022–2023 returned volumes to pre-pandemic levels. The 2025 recovery (+10%) was partly distorted by the Q1 stamp duty deadline rush.
Housing Tenure Breakdown
UK Tenure Split (Latest Available)
| Tenure | Share | Households |
|---|---|---|
| Owner-occupied (with mortgage) | ~29% | ~8.1 million |
| Owner-occupied (outright) | ~35% | ~9.8 million |
| Private rented | ~19% | ~5.3 million |
| Social rented | ~16% | ~4.5 million |
| Other | ~1% | ~0.3 million |
Homeownership by Age Group
| Age Group | Homeownership Rate |
|---|---|
| 25–34 | ~38% |
| 35–44 | ~56% |
| 45–54 | ~68% |
| 55–64 | ~76% |
| 65+ | ~78% |
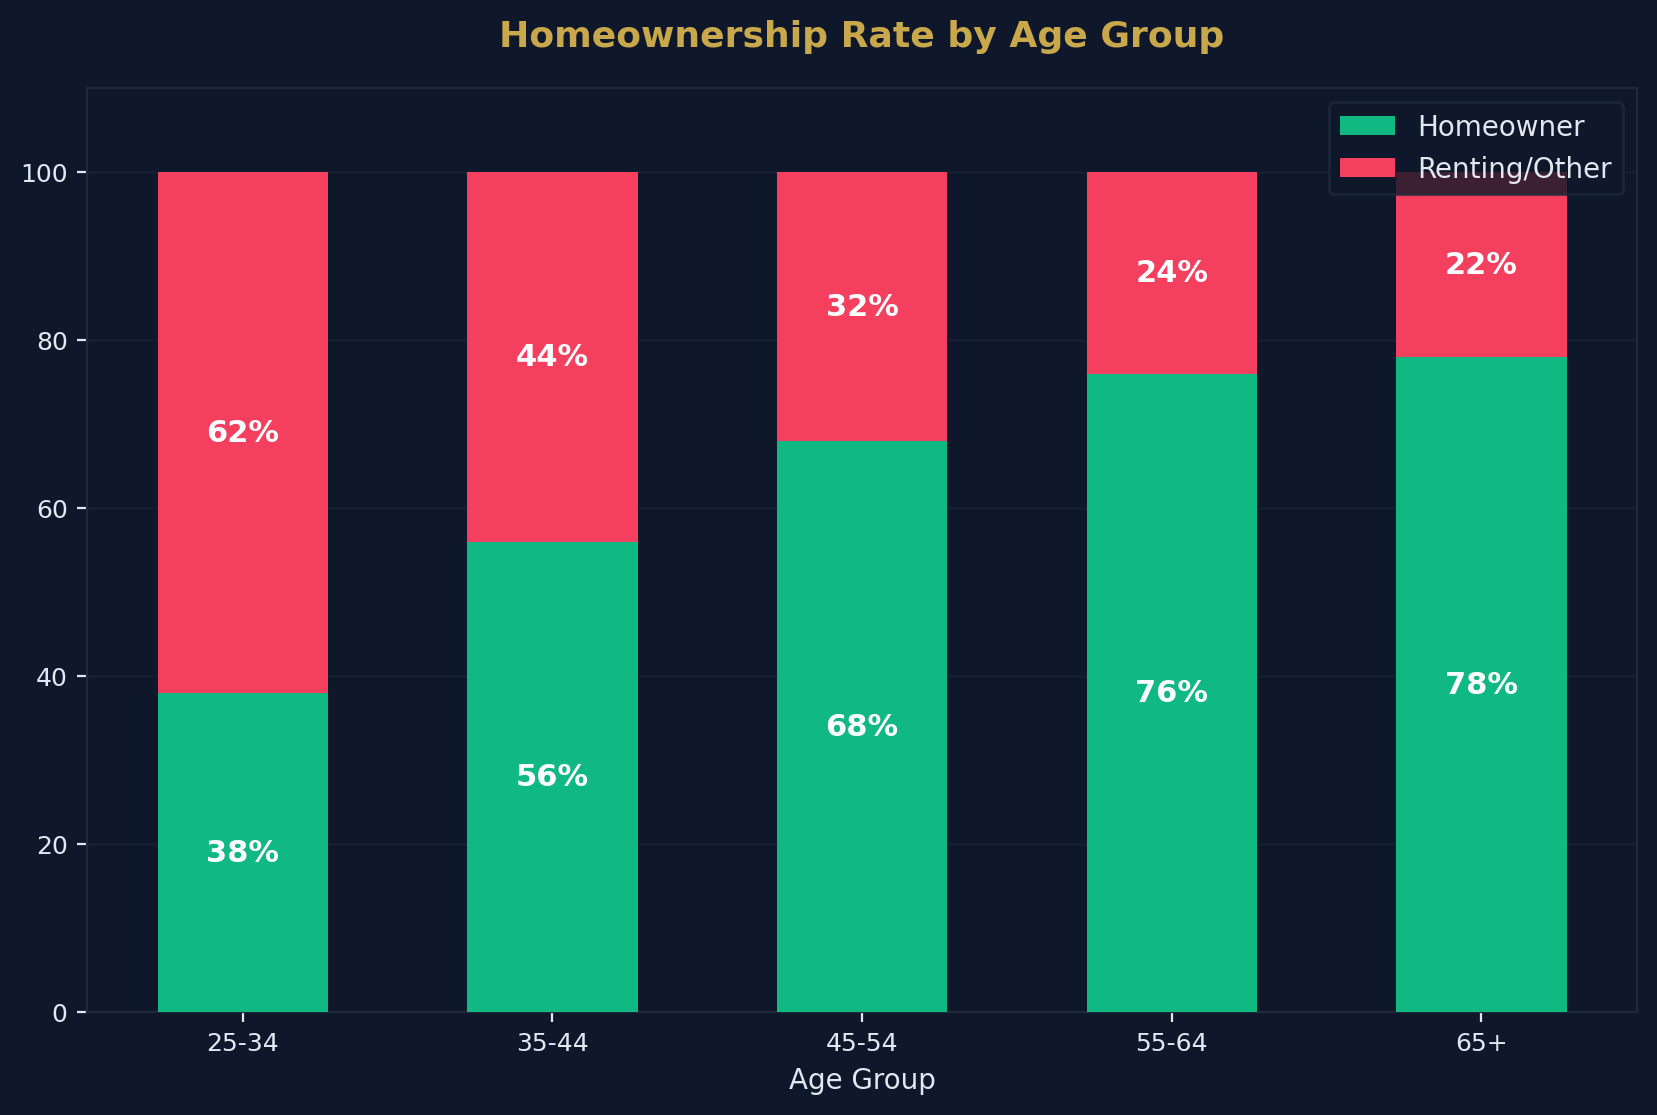
The Generational Housing Divide
The data reveals a stark generational divide:
- 76% of over-55s own their home — many outright
- Only 38% of 25–34 year olds are homeowners
- 68% of 23-year-olds still live with their parents — three times higher than a decade ago
- The share of homeownership in the 25–34 age group has fallen from approximately 55% in 2000 to 38% today
This divergence is the defining feature of the UK housing market. It drives demand for the private rented sector, underpins political pressure for affordable housing, and creates the conditions for intergenerational wealth transfer via the "Bank of Mum and Dad."
The Private Rented Sector
PRS in Decline
The private rented sector in England is experiencing its largest contraction this century:
- The PRS has contracted for three consecutive years (2024–2026)
- An estimated 220,000 households will exit the English PRS by end of 2026
- The contraction is driven by landlord sales, legislative pressure (Renters' Rights Act), and Section 24 tax changes
- Despite the shrinking supply, rent inflation has moderated to 3.4% — down from 6%+ in 2023
Why Landlords Are Leaving
| Factor | Impact |
|---|---|
| Section 24 tax changes | Reduced after-tax returns for personal landlords |
| Renters' Rights Act | Increased regulatory burden and compliance costs |
| 5% SDLT surcharge | Higher entry costs for new purchases |
| EPC C minimum (expected) | £5,000–£15,000 upgrade costs per property |
| Rising mortgage rates | Reduced cash flow, some portfolios now loss-making |
Who's Replacing Them
The exiting amateur landlords are being replaced by:
- Limited company operators: 75–80% of new BTL purchases via corporate structures
- Build-to-Rent institutions: Purpose-built rental developments by pension funds and REITs
- Portfolio landlords: Larger operators absorbing stock from single-property sellers
Housing Supply
Net Additions to Housing Stock
| Year | Net Additions | Target | Shortfall |
|---|---|---|---|
| 2020/21 | 216,490 | 300,000 | -83,510 |
| 2021/22 | 232,820 | 300,000 | -67,180 |
| 2022/23 | 234,400 | 300,000 | -65,600 |
| 2023/24 | 208,600 | 300,000 | -91,400 |
| 2024/25 | ~208,600 | 300,000 | -91,400 |
| 2025/26 | ~220,000 (est.) | 300,000 | -80,000 |
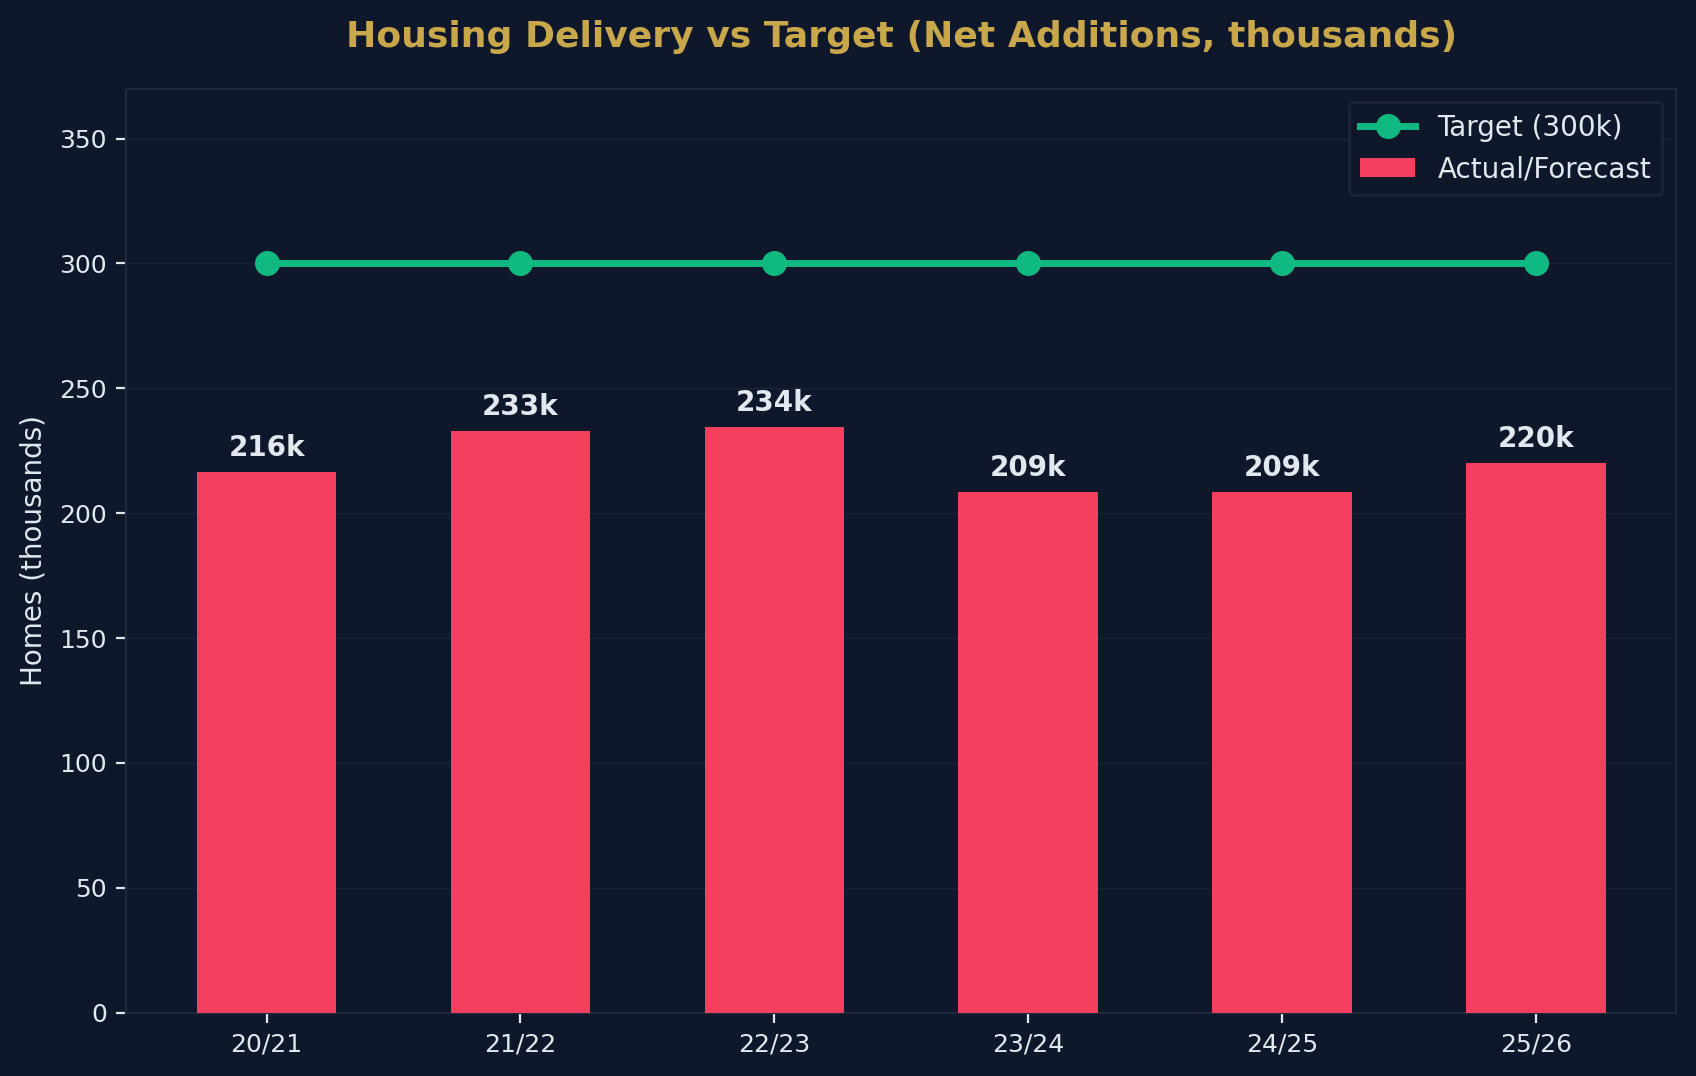
The Structural Undersupply
The UK has consistently built 80,000–100,000 fewer homes per year than needed. Over the past decade, this has created a cumulative shortfall of approximately 800,000–1,000,000 homes relative to household formation.
This undersupply is the single most important long-term price floor for UK property. Even during periods of economic weakness, the shortage of homes prevents significant price declines — a dynamic that has held true through every downturn since the 1990s.
Mortgage Market Overview
Key Lending Statistics (Early 2026)
| Metric | Figure |
|---|---|
| BoE base rate | 3.75% |
| Average 2-year fixed (75% LTV) | ~4.5% |
| Average 5-year fixed (75% LTV) | ~4.2% |
| Net mortgage approvals (Feb 2026) | 62,600 |
| First-time buyer share of mortgages | 54% |
| Average mortgage term (new) | 30+ years |
| 35+ year terms | Increasingly standard |
Mortgage Affordability
The BoE's effective interest rate on new mortgage drawdowns has risen from a low of ~1.5% in 2021 to approximately 4.1% in early 2026. While this is significantly higher than the ultra-low pandemic era, it remains below the long-term historical average of ~5%.
For a borrower taking a £200,000 mortgage:
- At 1.5% (2021): Monthly payment ~£690
- At 4.1% (2026): Monthly payment ~£970
- At 5.0% (historical average): Monthly payment ~£1,074
The +£280/month increase since 2021 represents the primary affordability headwind facing the market.
House Price Index: Historical Context
UK Average House Price (Selected Years)
| Year | Average Price | Decade Change |
|---|---|---|
| 1995 | £55,000 | — |
| 2000 | £82,000 | +49% |
| 2005 | £155,000 | +89% |
| 2010 | £167,000 | +8% |
| 2015 | £195,000 | +17% |
| 2020 | £235,000 | +21% |
| 2026 | £268,000 | +14% (6 years) |
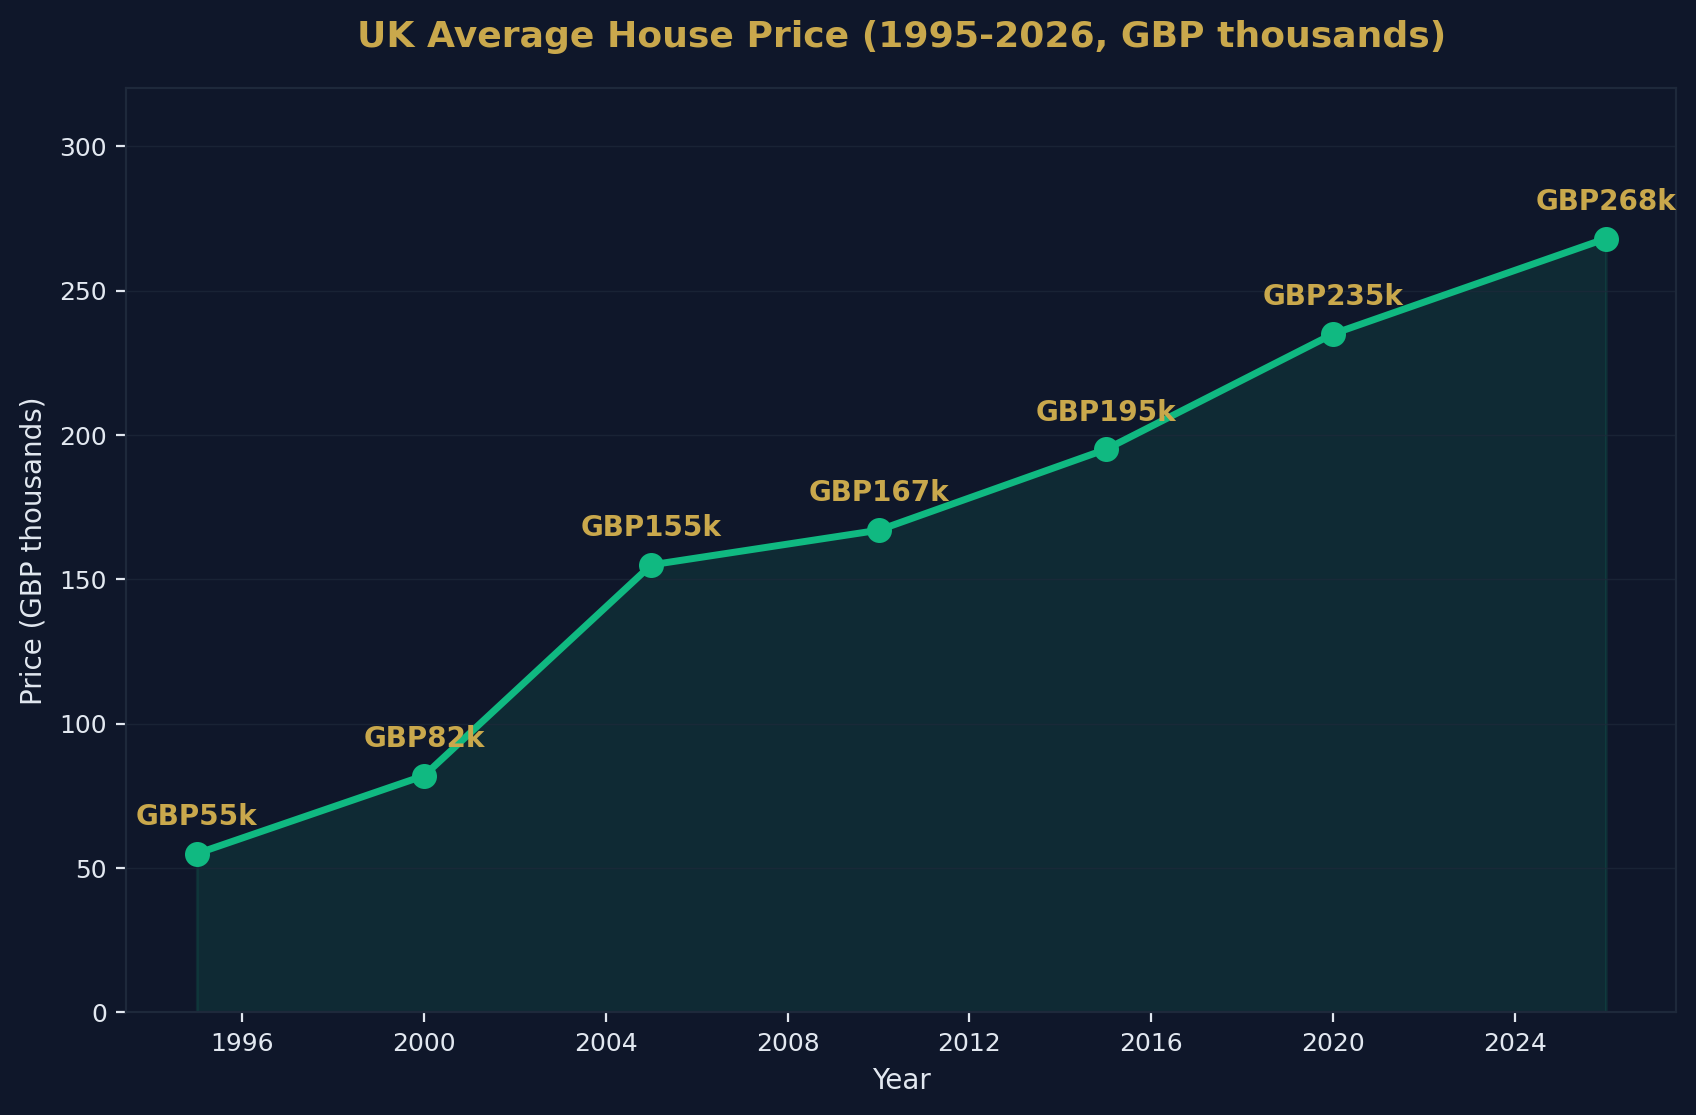
The long-term trajectory is unambiguous: UK house prices have risen by +387% since 1995 — an average of approximately 5.3% per year. Even accounting for inflation, real prices have more than doubled.
Methodology and Data Sources
| Source | Data Type | Coverage |
|---|---|---|
| ONS UK HPI | House prices, annual change | UK nations & regions |
| HM Land Registry | Transaction prices, volumes | England & Wales |
| HMRC | Monthly transactions, SDLT | UK |
| DLUHC | Net additions, housing stock | England |
| English Housing Survey | Tenure, demographics | England |
| Bank of England | Mortgage approvals, rates | UK |
| Savills / JLL | Forecasts | UK |
How to Cite This Page
UK Housing Market Statistics 2026. Shaded Canvas. Published April 2026, updated quarterly. Available at: https://blog.shadedcanvas.co.uk/post/uk-housing-market-statistics-2026
Stop being a landlord. Start being an investor.
Shaded Canvas introduces serious capital to vetted UK property opportunities — targeting 12–16% net returns.
Start Investing →