Investors searching for 'Standard Life Investments UK real estate' are typically looking for one of two things: information about the legacy <a href="https://blog.shadedcanvas.co.uk/post/<a href="https://blog.shadedcanvas.co.uk/post/<a href="https://blog.shadedcanvas.co.uk/post/sli-uk-real-estate" style="color:#c9a84c;text-decoration:underline;font-weight:500">sli-uk-real-estate" style="color:#c9a84c;text-decoration:underline;font-weight:500">sli-uk-real-estate" style="color:#c9a84c;text-decoration:underline;font-weight:500">sli funds now managed under the abrdn umbrella, or an assessment of whether the platform remains competitive in a market where REITs, direct investment, and new alternative structures are all competing for the same allocation. This deep dive addresses both.
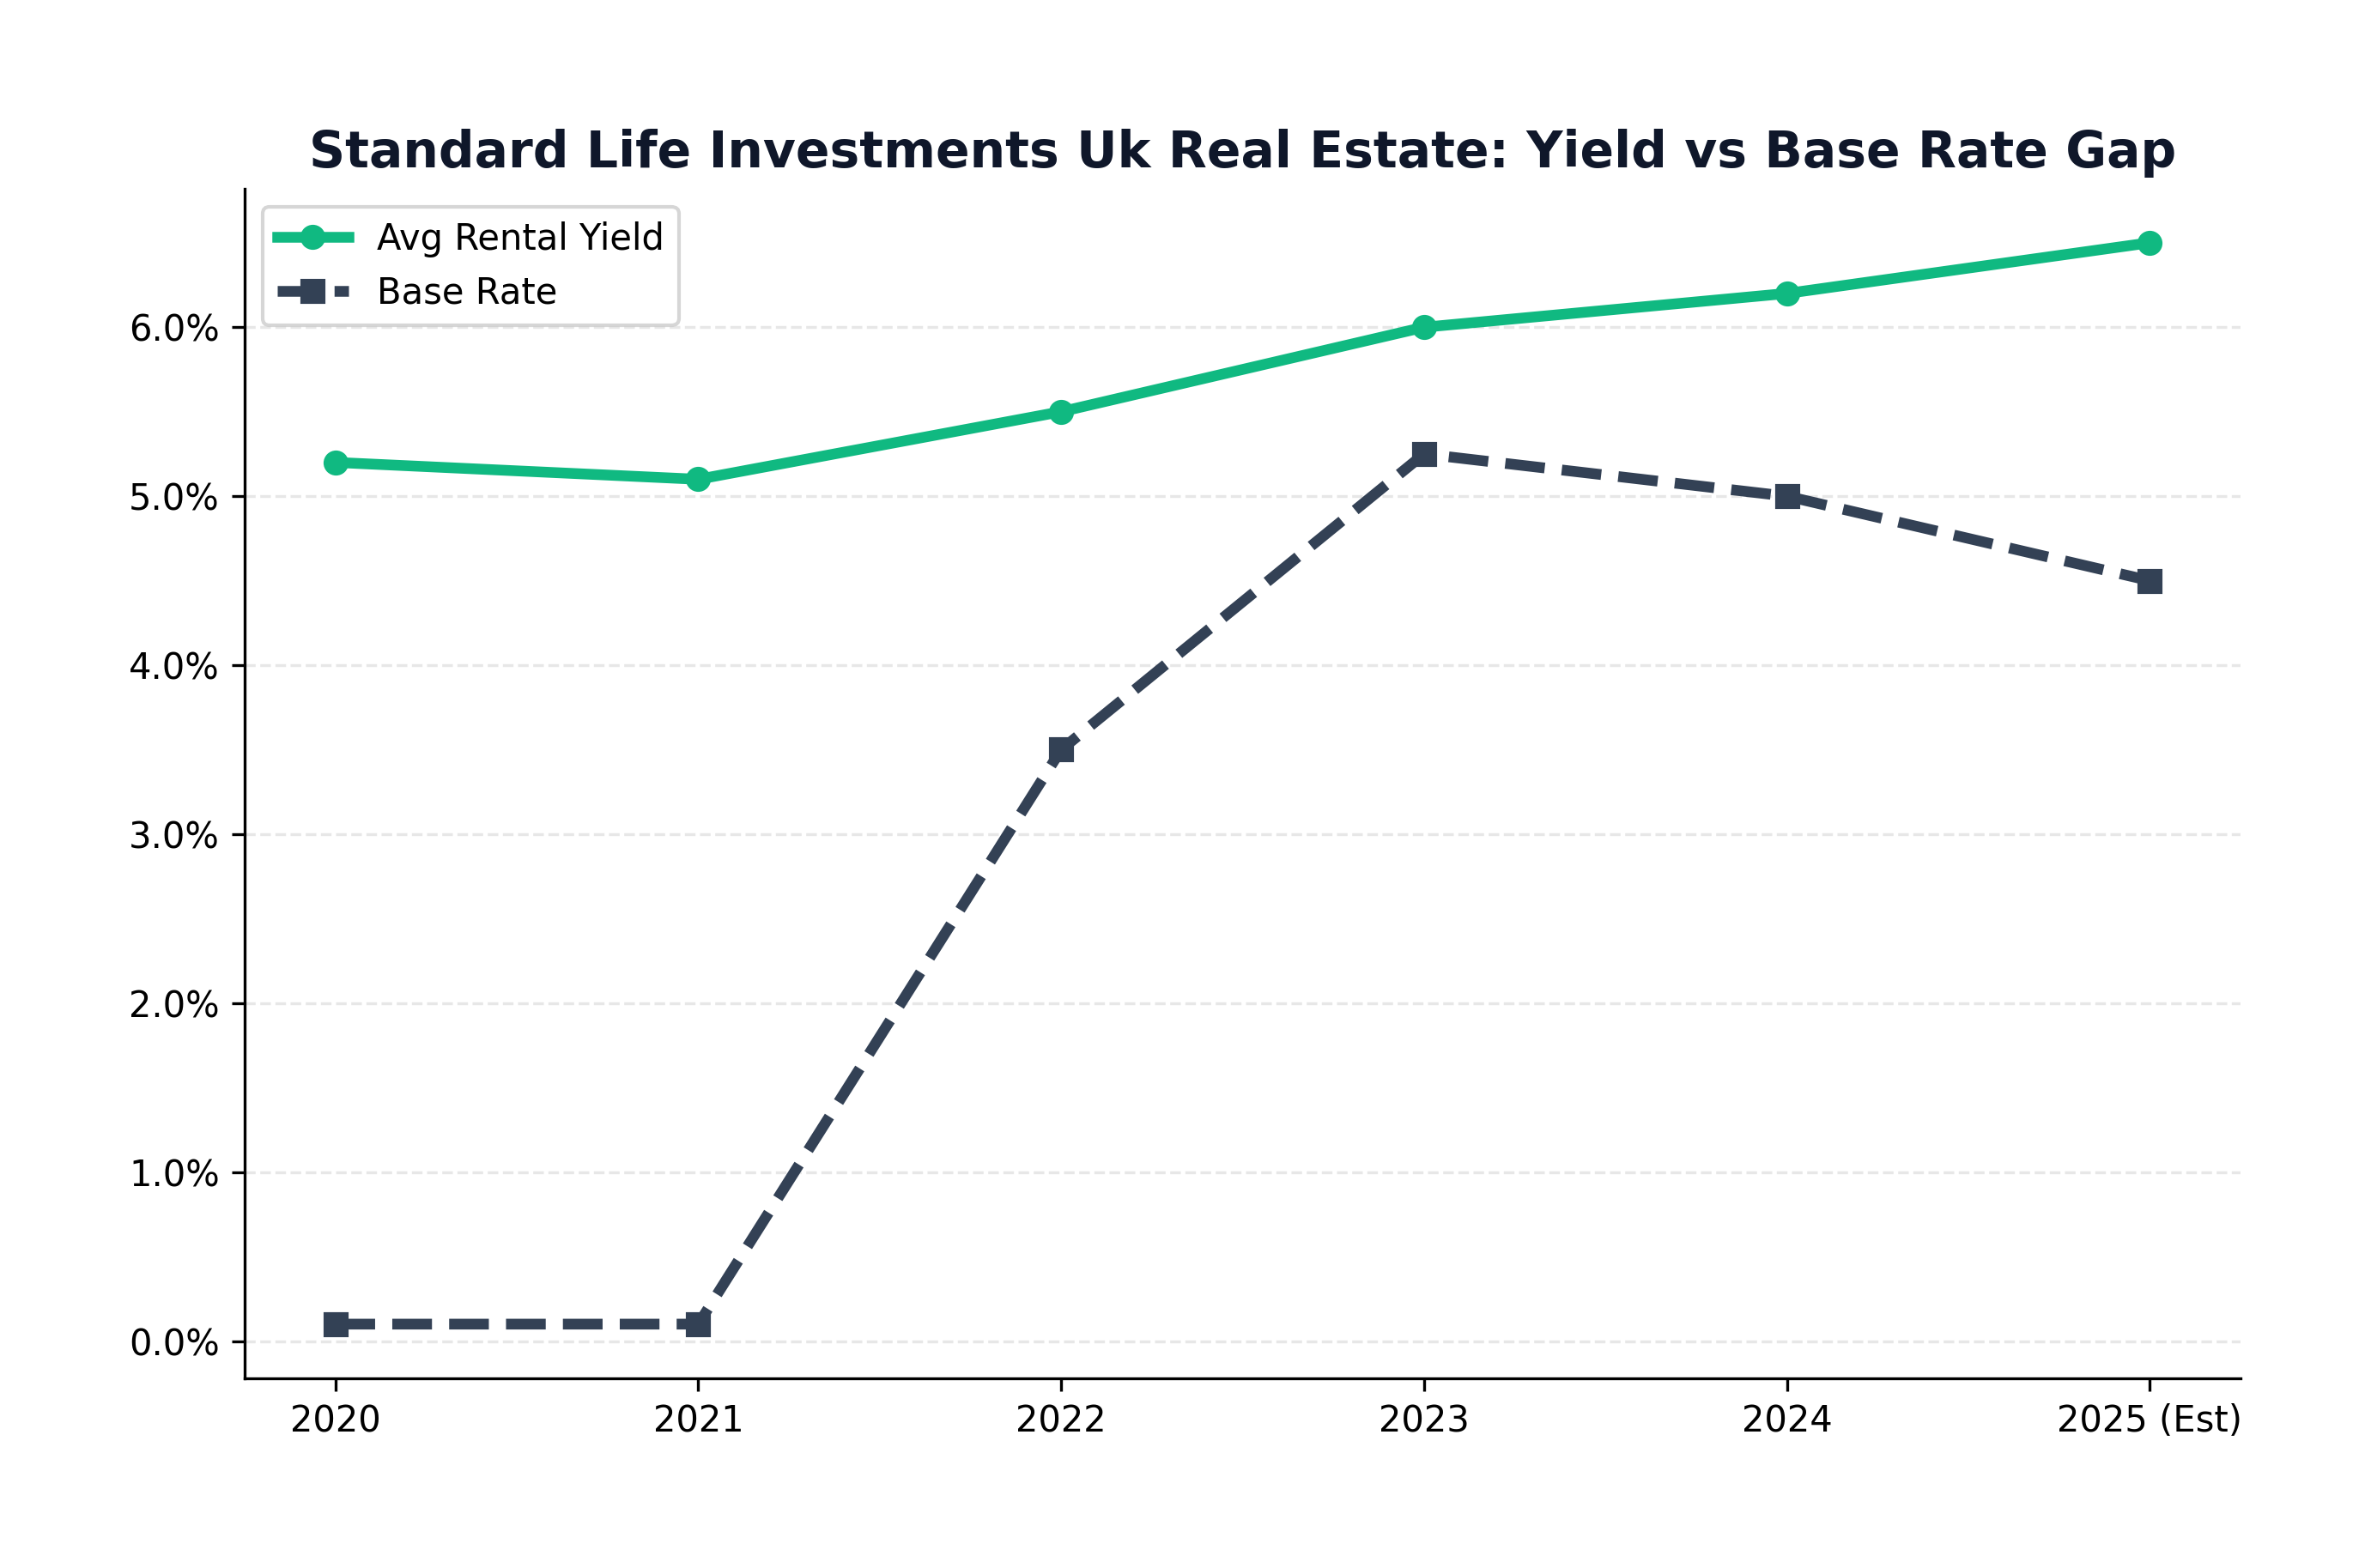 Figure: Yield vs Interest Rates
The Legacy of Standard Life Real Estate
Standard Life's UK property investment capability has its roots in the management of the group's own with-profits annuity book — one of the largest in the UK. This heritage means the team has managed through multiple full property cycles, including the 1990s commercial property crash, the 2008 financial crisis, and the COVID-induced repricing of 2020. That cycle experience is genuinely valuable and not replicated by newer fund managers.
The 2017 merger with Aberdeen Asset Management to form Standard Life Aberdeen (subsequently rebranded abrdn) brought operational efficiencies but also integration complexity. The real estate team retained core personnel, which provided continuity for existing mandates, but the broader group's strategic priorities — building a technology platform, expanding into wealth management — have diverted attention and resource from pure property investment in the years since.
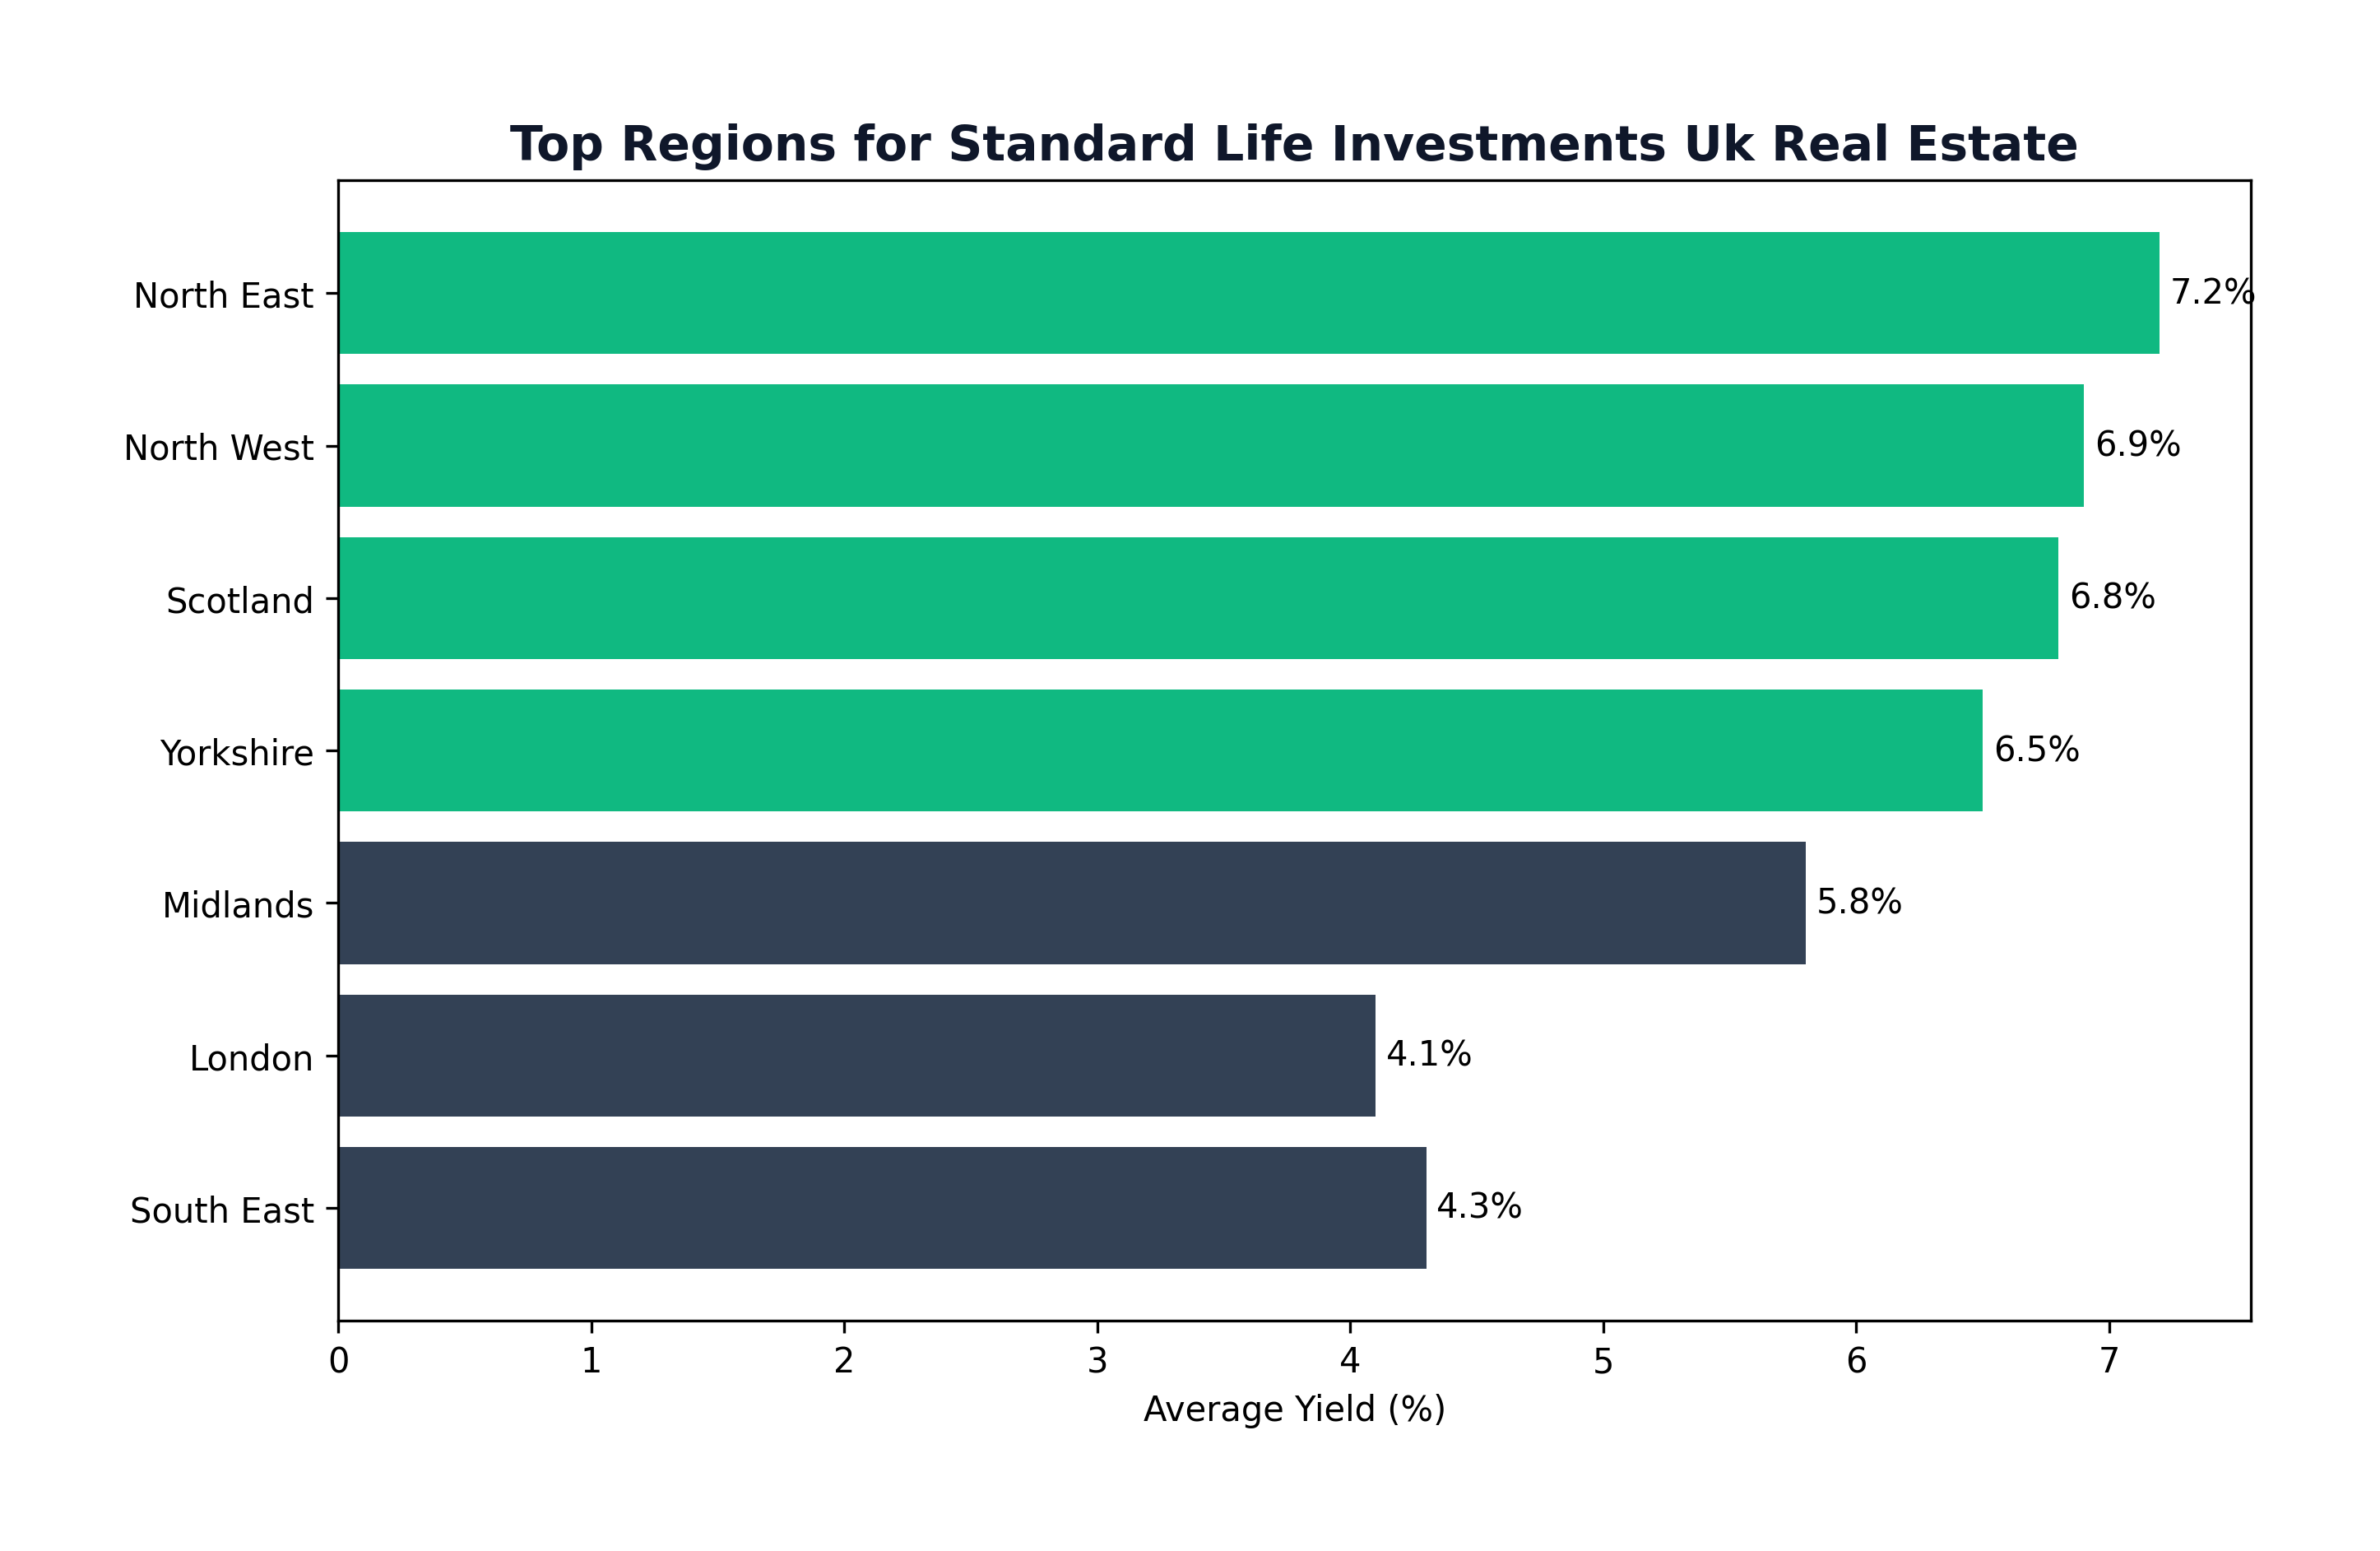 Figure: Regional Yield Heatmap
Portfolio Deep Dive: Key Holdings and Sector Analysis
The fund's largest direct holdings are concentrated in logistics and industrial assets — a deliberate overweight relative to the MSCI benchmark that has contributed positively to performance as e-commerce-driven demand compressed industrial yields during 2020–2022. The portfolio includes a number of multi-let industrial estates in the Midlands and South East, where occupancy rates have remained strong and rental growth has been above general CPI inflation.
The commercial office exposure remains a challenge. Holdings in secondary office space — particularly assets outside London and outside the top tier of regional cities — are experiencing valuation pressure as occupiers consolidate into higher-quality space. The fund has taken impairment charges on some office assets, and the disposal strategy for these assets will require either accepting below-valuation pricing or investing capital to upgrade specifications to meet current occupier expectations for ESG credentials, amenities, and energy performance.
Retail warehouse exposure has been a relative positive in recent years. The narrative around retail was universally negative in 2018–2020, creating a valuation opportunity in out-of-town retail parks that has since partially corrected. The fund's holdings in this segment have benefitted from improving retailer footfall data, particularly from discount grocery anchors and value-oriented fashion retailers who have expanded their out-of-town presence.
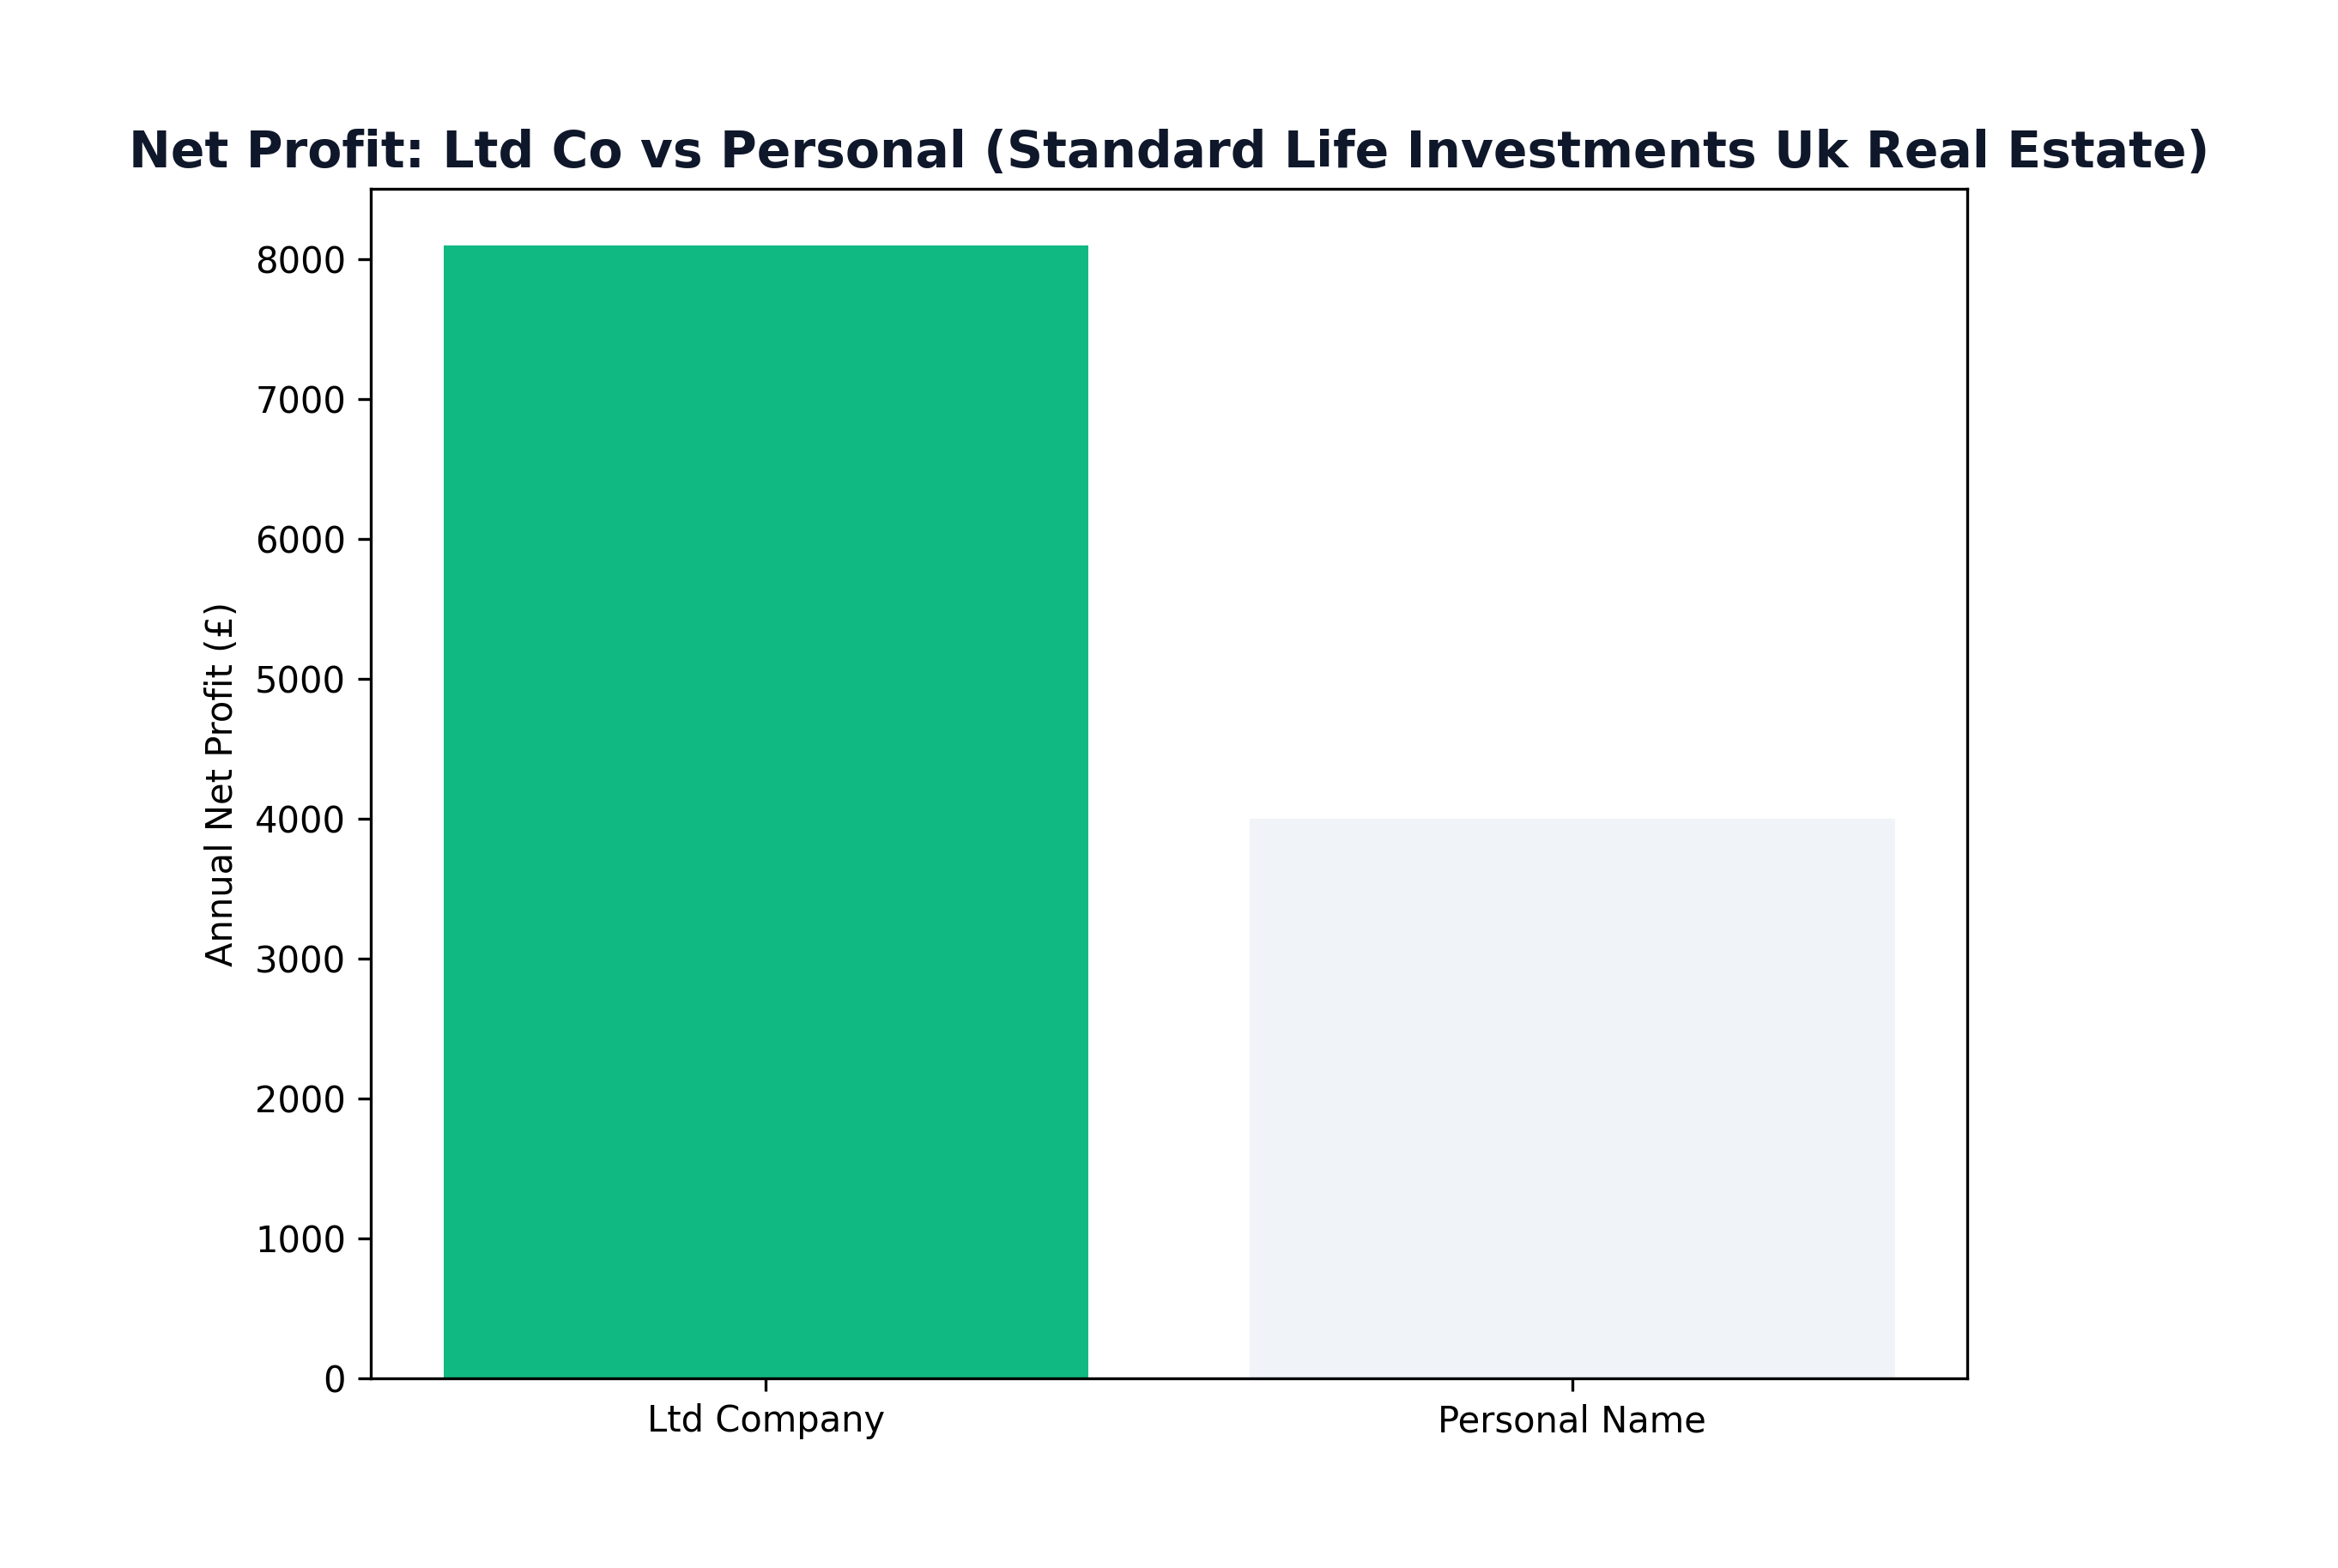 Figure: Tax Trap: Personal vs Ltd
Direct vs Indirect Exposure: The 2024 Transition Strategy
A significant strategic shift has occurred in the fund's composition: a deliberate increase in indirect exposure (holdings in listed REITs and other property vehicles) as a proportion of total assets. This reduces pure property beta in the portfolio but adds equity market correlation — investors in a 'property fund' may find their returns are partly driven by stock market sentiment rather than underlying rental and capital value movements.
The rationale from abrdn's perspective is liquidity management: listed positions can be sold quickly in the event of significant redemption pressure, avoiding the need to sell direct property assets at distressed prices. From an investor's perspective, the question is whether they are paying property fund fees for what is partly a listed equities exposure.
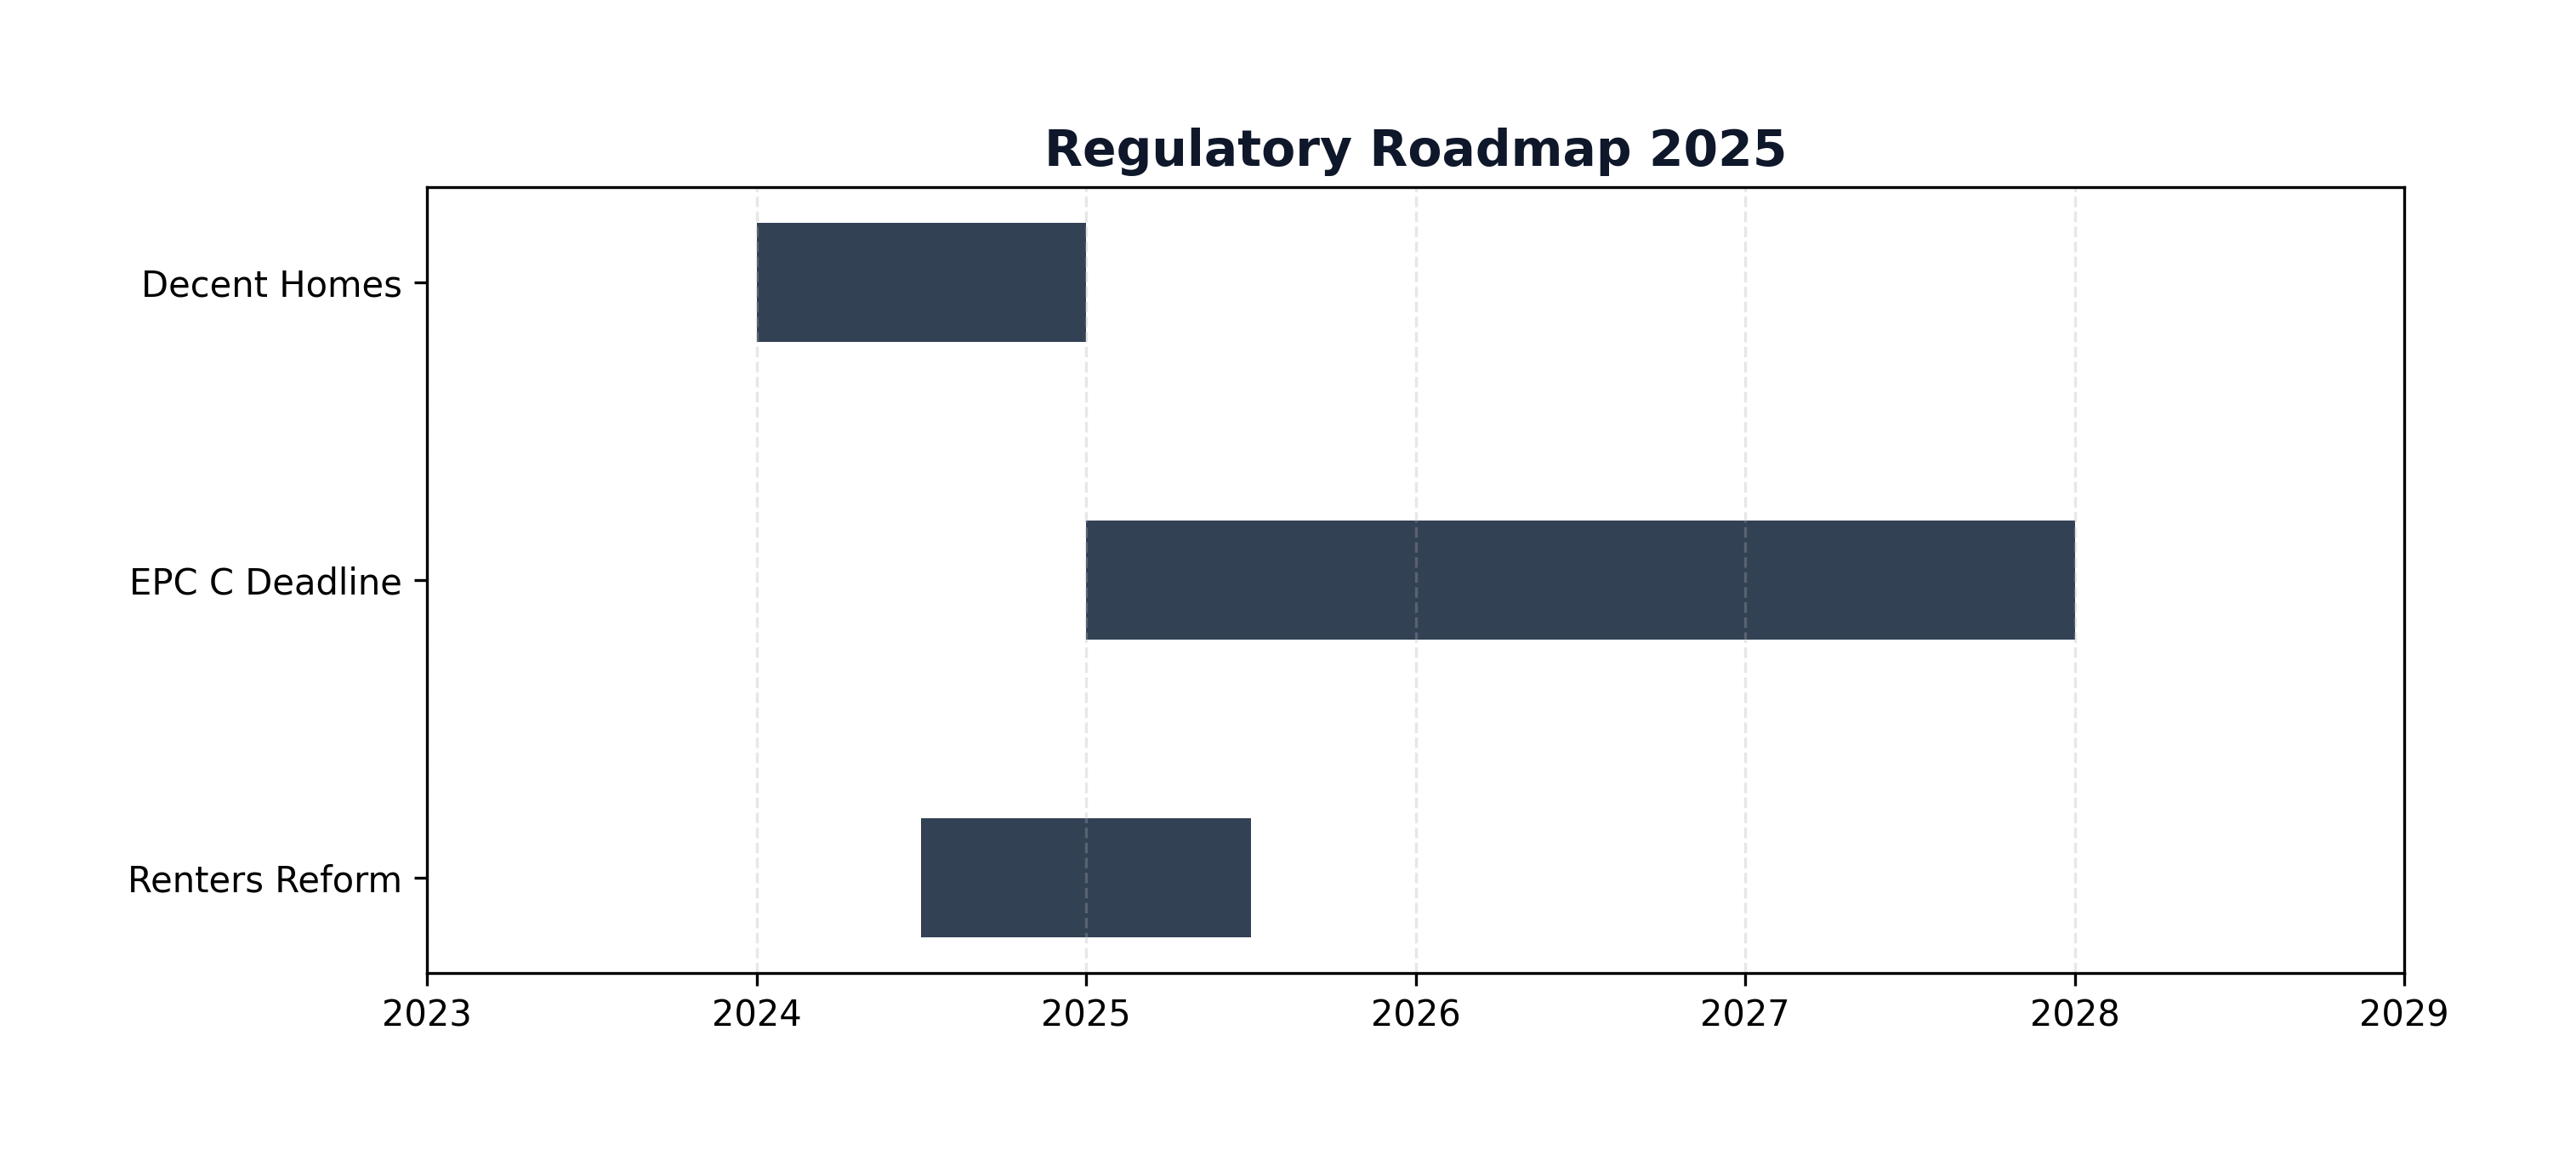 Figure: Regulatory Roadmap
Fees and Charges: The Performance Drag
The Ongoing Charges Figure (OCF) for the retail-accessible version of the fund sits in the range of 0.8–1.2% per annum, depending on the specific share class and access route. On top of this, transaction costs — stamp duty land tax on property purchases, legal fees, agent fees — are incurred by the fund on acquisitions and disposals and are borne by investors. The combined drag of annual fees and transaction costs can represent 1.5–2% of net assets per year in active periods.
Compared to listed REIT alternatives (where the equivalent management expense ratio runs at 0.4–0.8% and there is no hidden transaction cost layer), the cost advantage of the fund structure is unclear. The argument for active management is that stock selection — choosing the right properties in the right locations — adds sufficient alpha to justify the fee premium. The evidence for consistent alpha generation in UK commercial property is, to put it diplomatically, mixed across the industry.
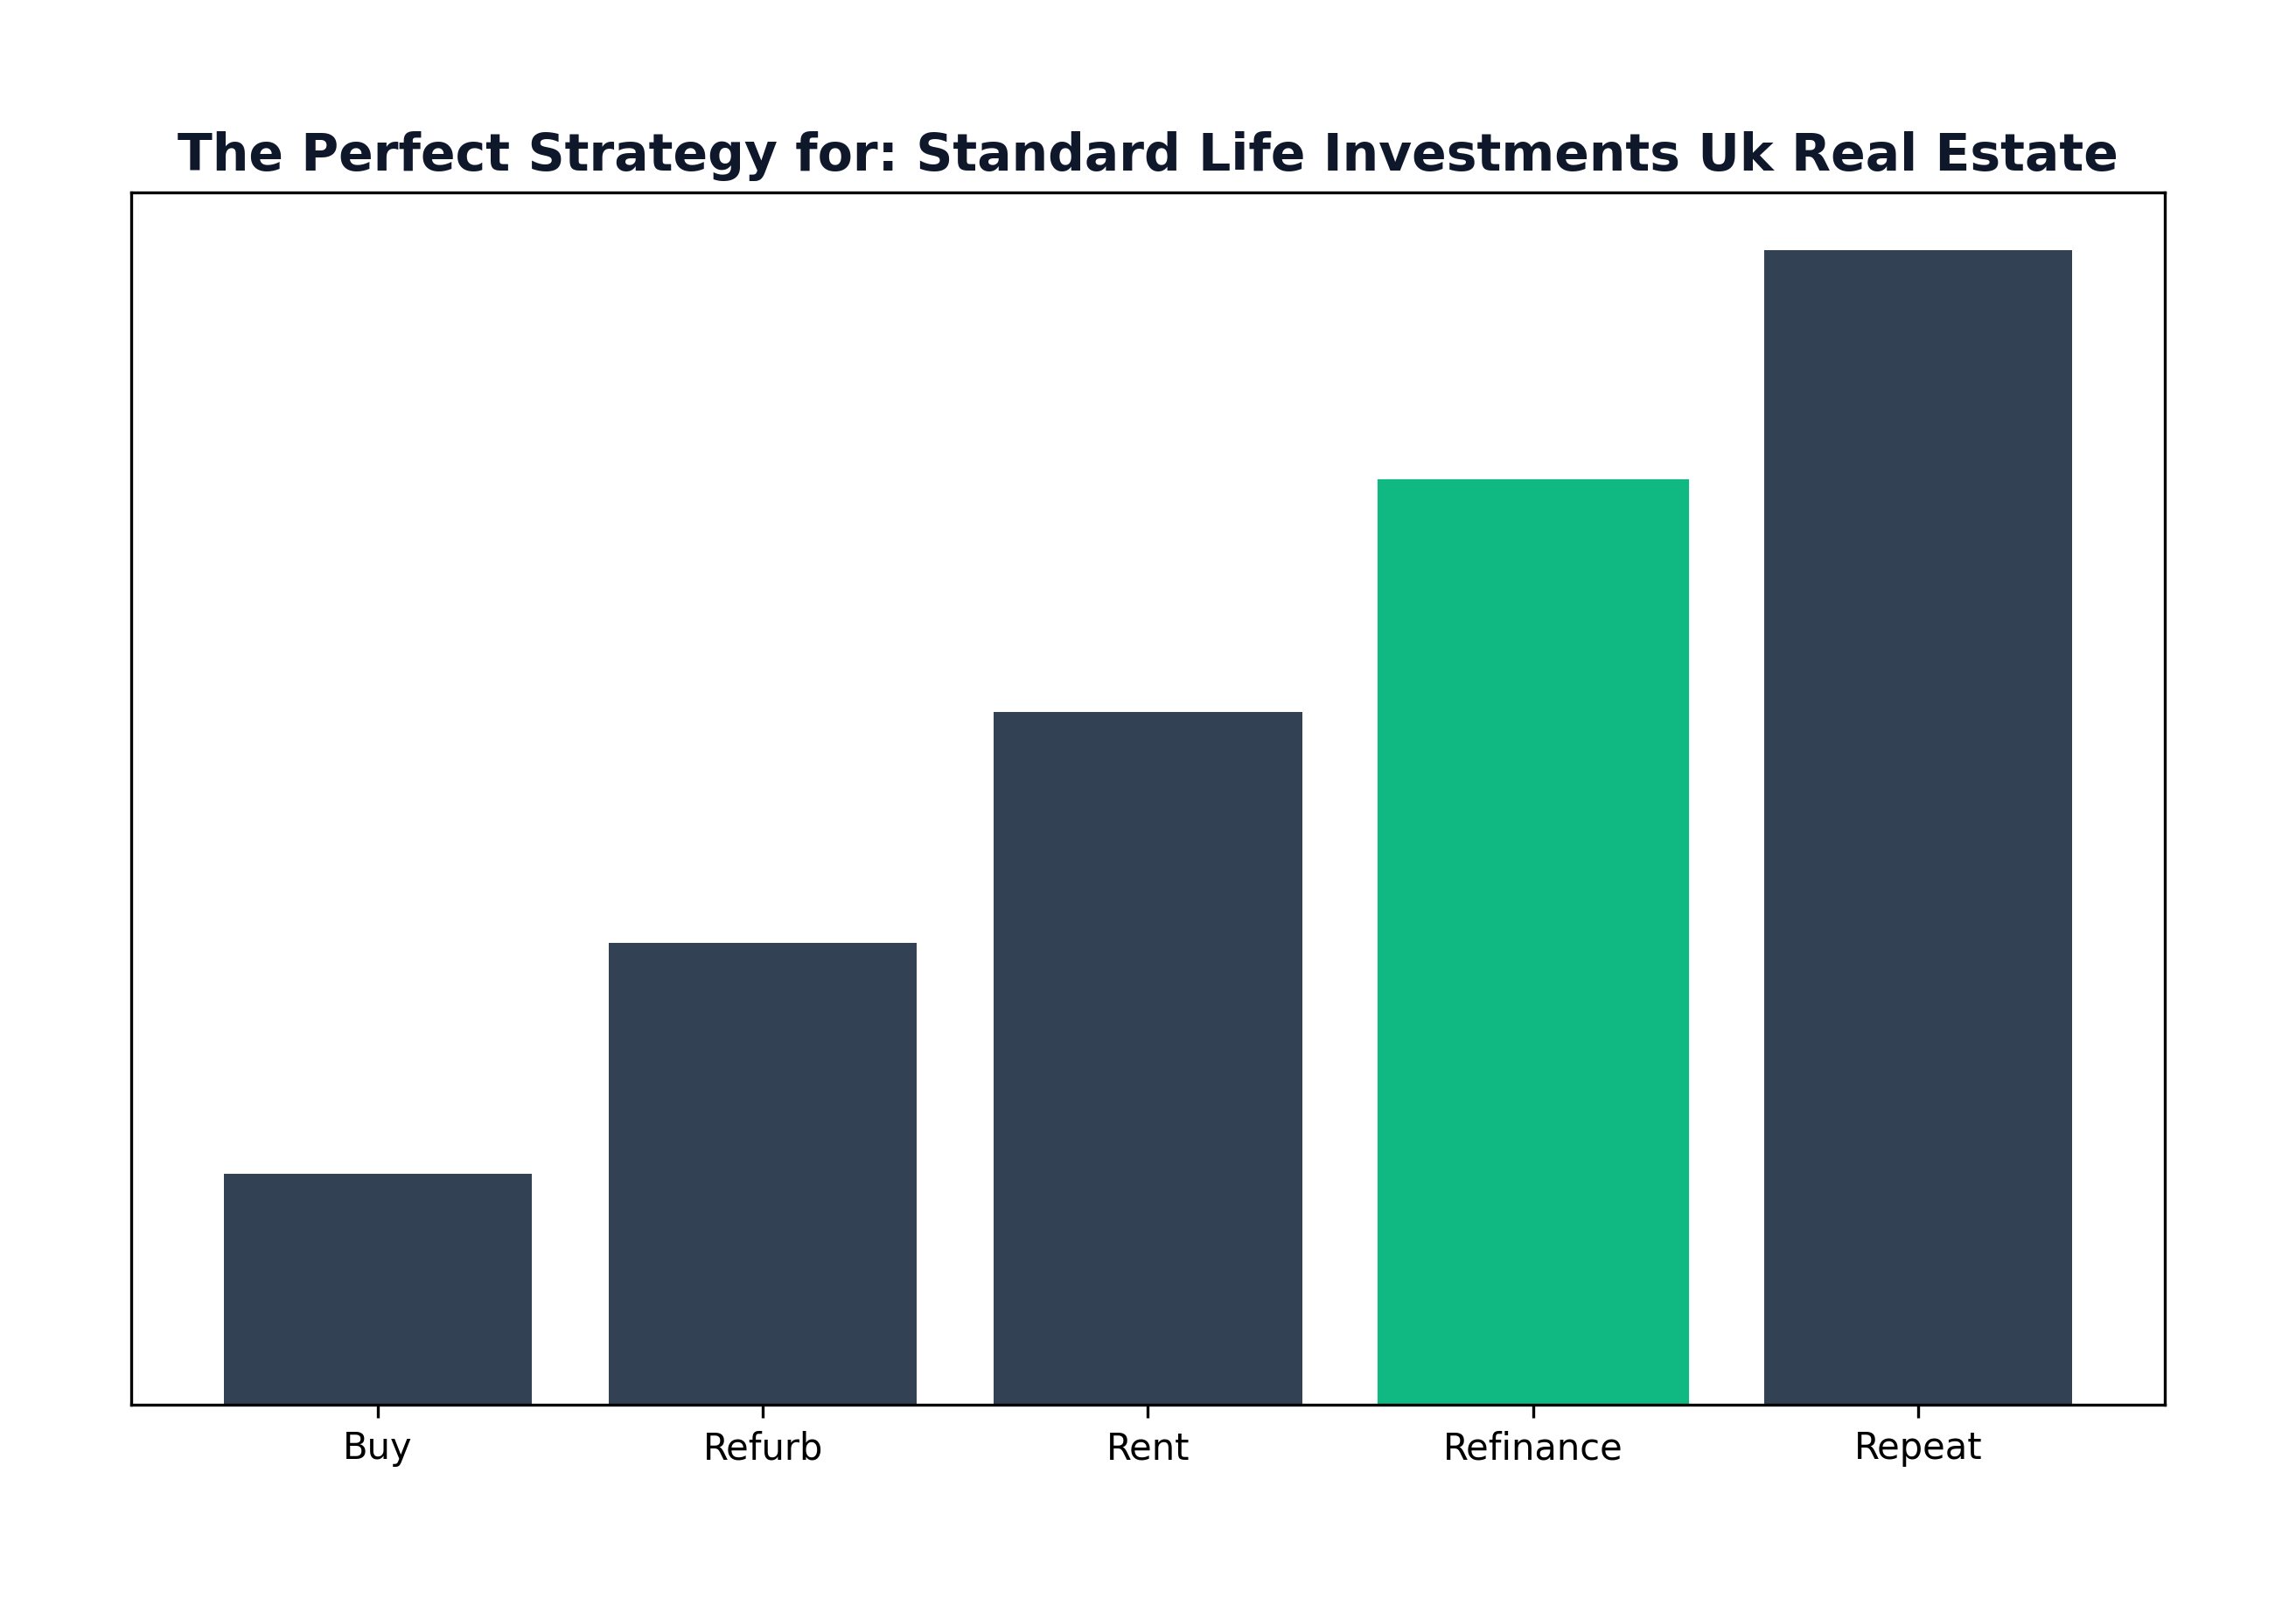 Figure: Strategy Cycle
Investor Sentiment and Market View
Forum and community discussions among institutional investors — particularly on platforms frequented by pension fund trustees and independent financial advisers — reflect a broadly cautious view of open-ended property funds as a category following the 2016 and 2020 suspensions. The consensus view is that the gatting risk, combined with fees above passive alternatives, makes these vehicles difficult to recommend as core holdings in a liquid portfolio. The typical positioning, where it remains, is as a satellite allocation within a wider multi-asset portfolio, sized to withstand full illiquidity without disrupting the wider strategy.
For long-horizon institutional investors (pension funds with 20+ year horizons), the calculus is different: liquidity is less critical, the diversification away from listed markets is genuinely valuable, and the track record of the SLI/abrdn team in property cycles is a legitimate competitive advantage. The fund's strongest case is made for this audience.
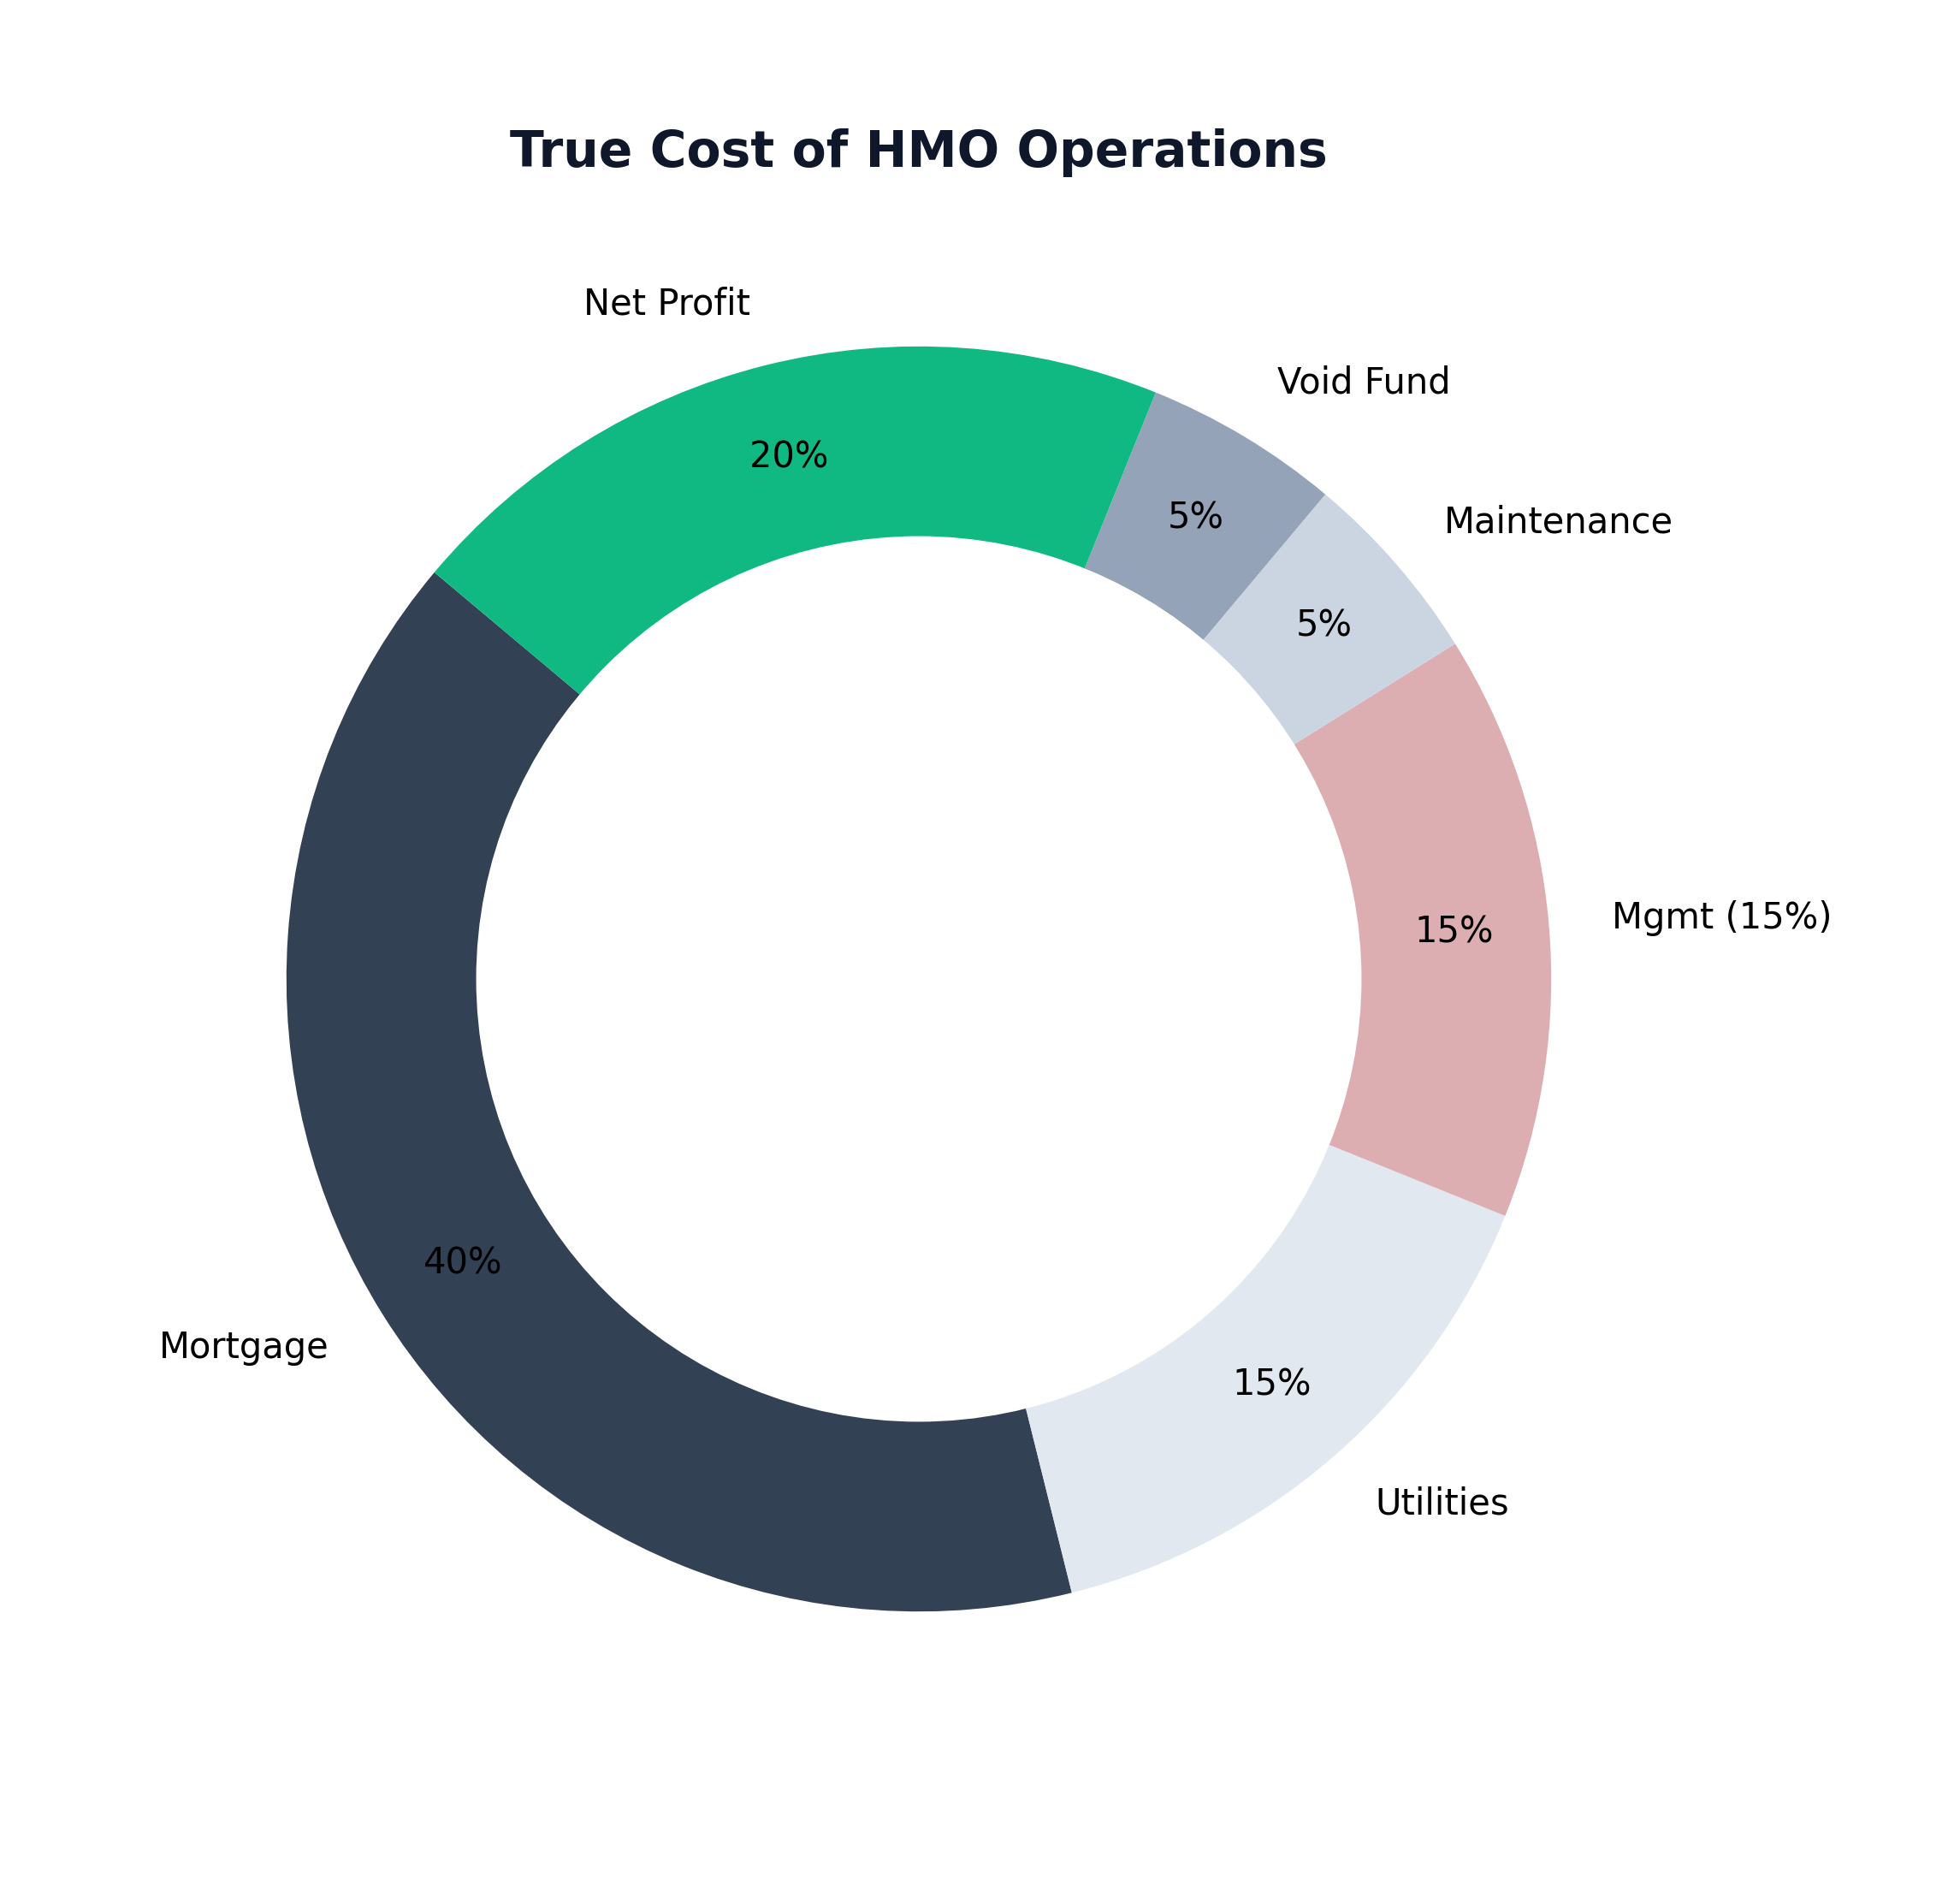 Figure: HMO Expense Breakdown
Final Assessment: Hold, Review, or Sell?
Existing investors should review their position with specific attention to three questions: first, has the fund's allocation to direct property drifted below 50% of NAV, effectively making it a blended fund at a property fund price? Second, have the fund's 3-year returns consistently beaten the MSCI benchmark net of fees? Third, is the liquidity risk appropriately sized relative to the total portfolio? For most retail investors, a reallocation toward listed REITs with equivalent diversification and lower fees would be defensible. For institutional investors with genuine long-term horizons, the fund remains a viable option provided the team and strategy remain stable.
Stop being a landlord. Start being an investor.
Shaded Canvas introduces serious capital to vetted UK property opportunities — targeting 12–16% net returns.
Start Investing →