

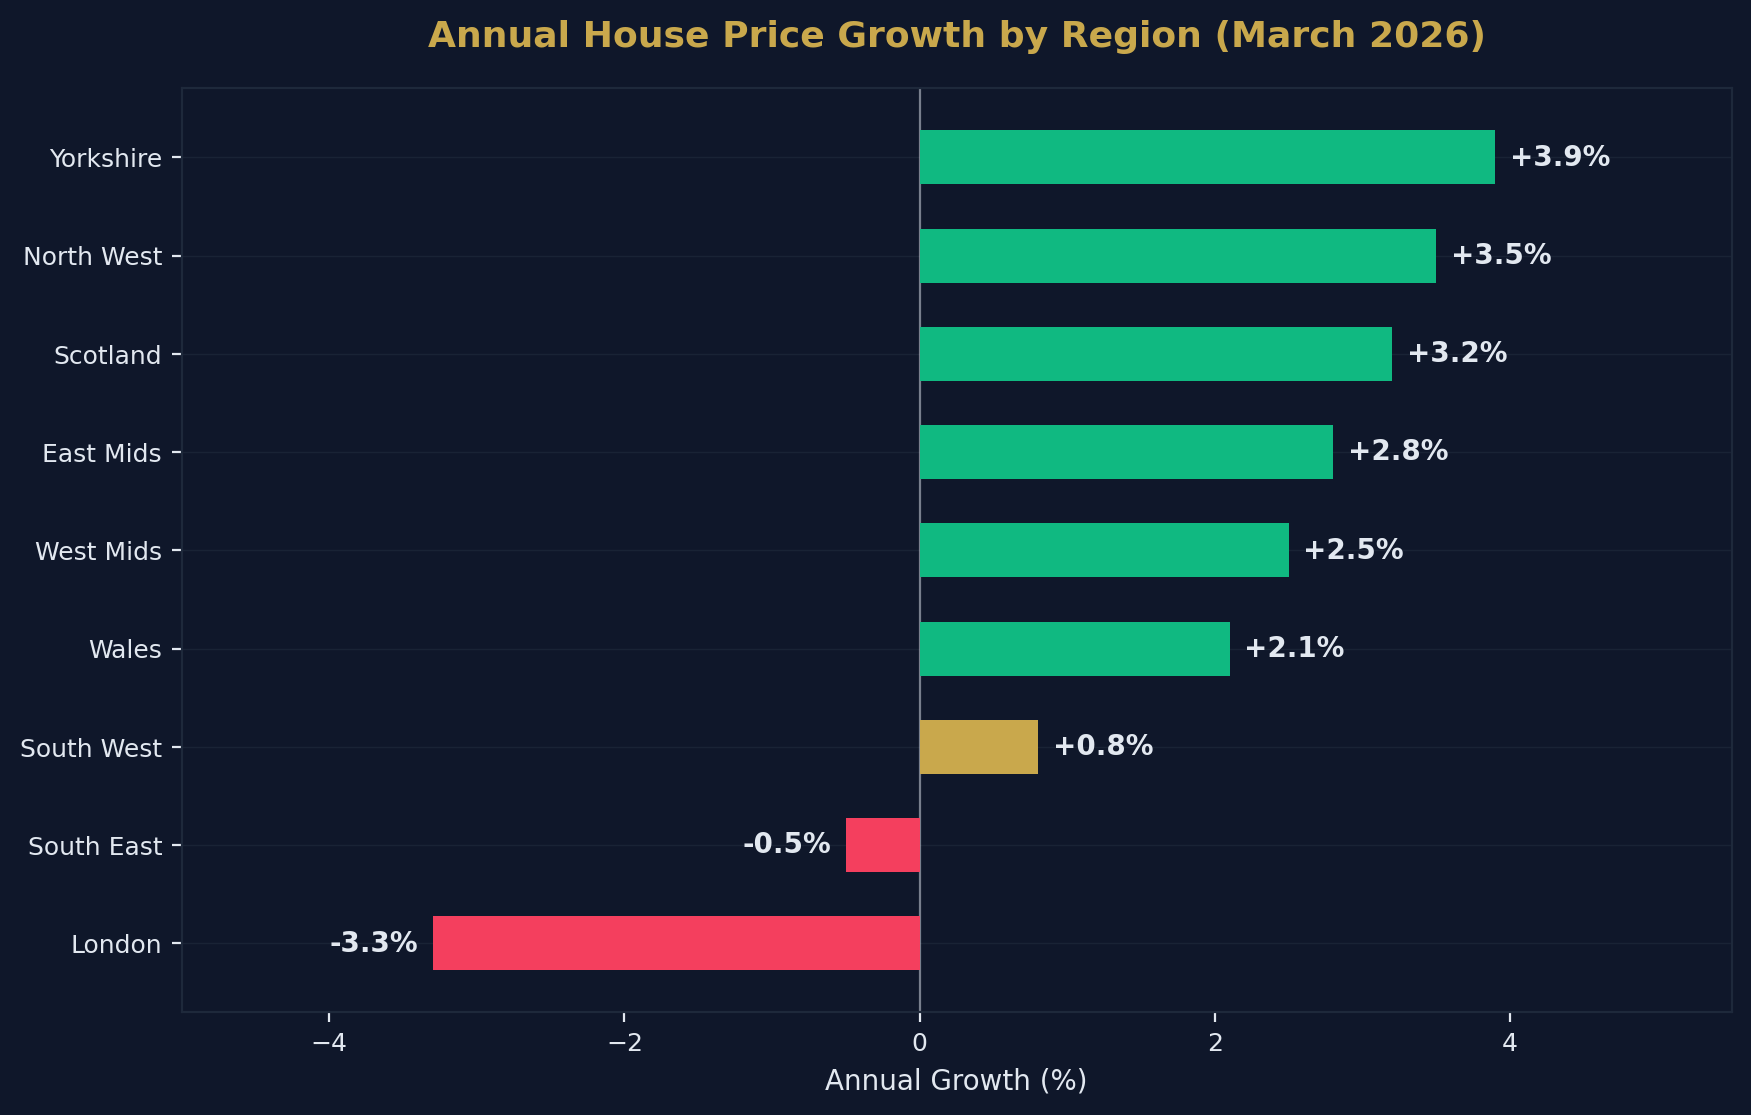
The UK property market in 2026 is defined by one theme: divergence. Northern cities are delivering 6–8% rental yields and steady capital growth, while parts of the South are flat or declining. Yorkshire is up +3.9% year-on-year; London is down -3.3%. The gap between the best and worst performing regions is the widest in over a decade.
This guide ranks the top cities for property investment in 2026 using hard data: average prices, gross yields, capital growth, tenant demand, and infrastructure investment. Whether you are buying your first buy-to-let or scaling a portfolio through a limited company, this is where the numbers point.
Last Updated: April 2026 | Data Sources: ONS, Zoopla, Hometrack, Land Registry
The Big Picture: North vs South
Regional Performance (Year to March 2026)
| Region | Avg House Price | Annual Growth | Avg Gross Yield |
|---|---|---|---|
| Yorkshire & Humber | £205,000 | +3.9% | 6.8% |
| North West | £210,000 | +3.5% | 7.1% |
| East Midlands | £235,000 | +2.8% | 5.9% |
| West Midlands | £240,000 | +2.5% | 5.7% |
| Scotland | £195,000 | +3.2% | 6.5% |
| Wales | £215,000 | +2.1% | 5.5% |
| South West | £325,000 | +0.8% | 4.6% |
| South East | £385,000 | -0.5% | 3.8% |
| London | £530,000 | -3.3% | 3.5% |
| UK Average | £268,000 | +1.2% | 5.2% |
The North West and Yorkshire deliver double the yield of London at less than half the entry price.
Top 10 Cities for Property Investment in 2026
1. Manchester
| Metric | Value |
|---|---|
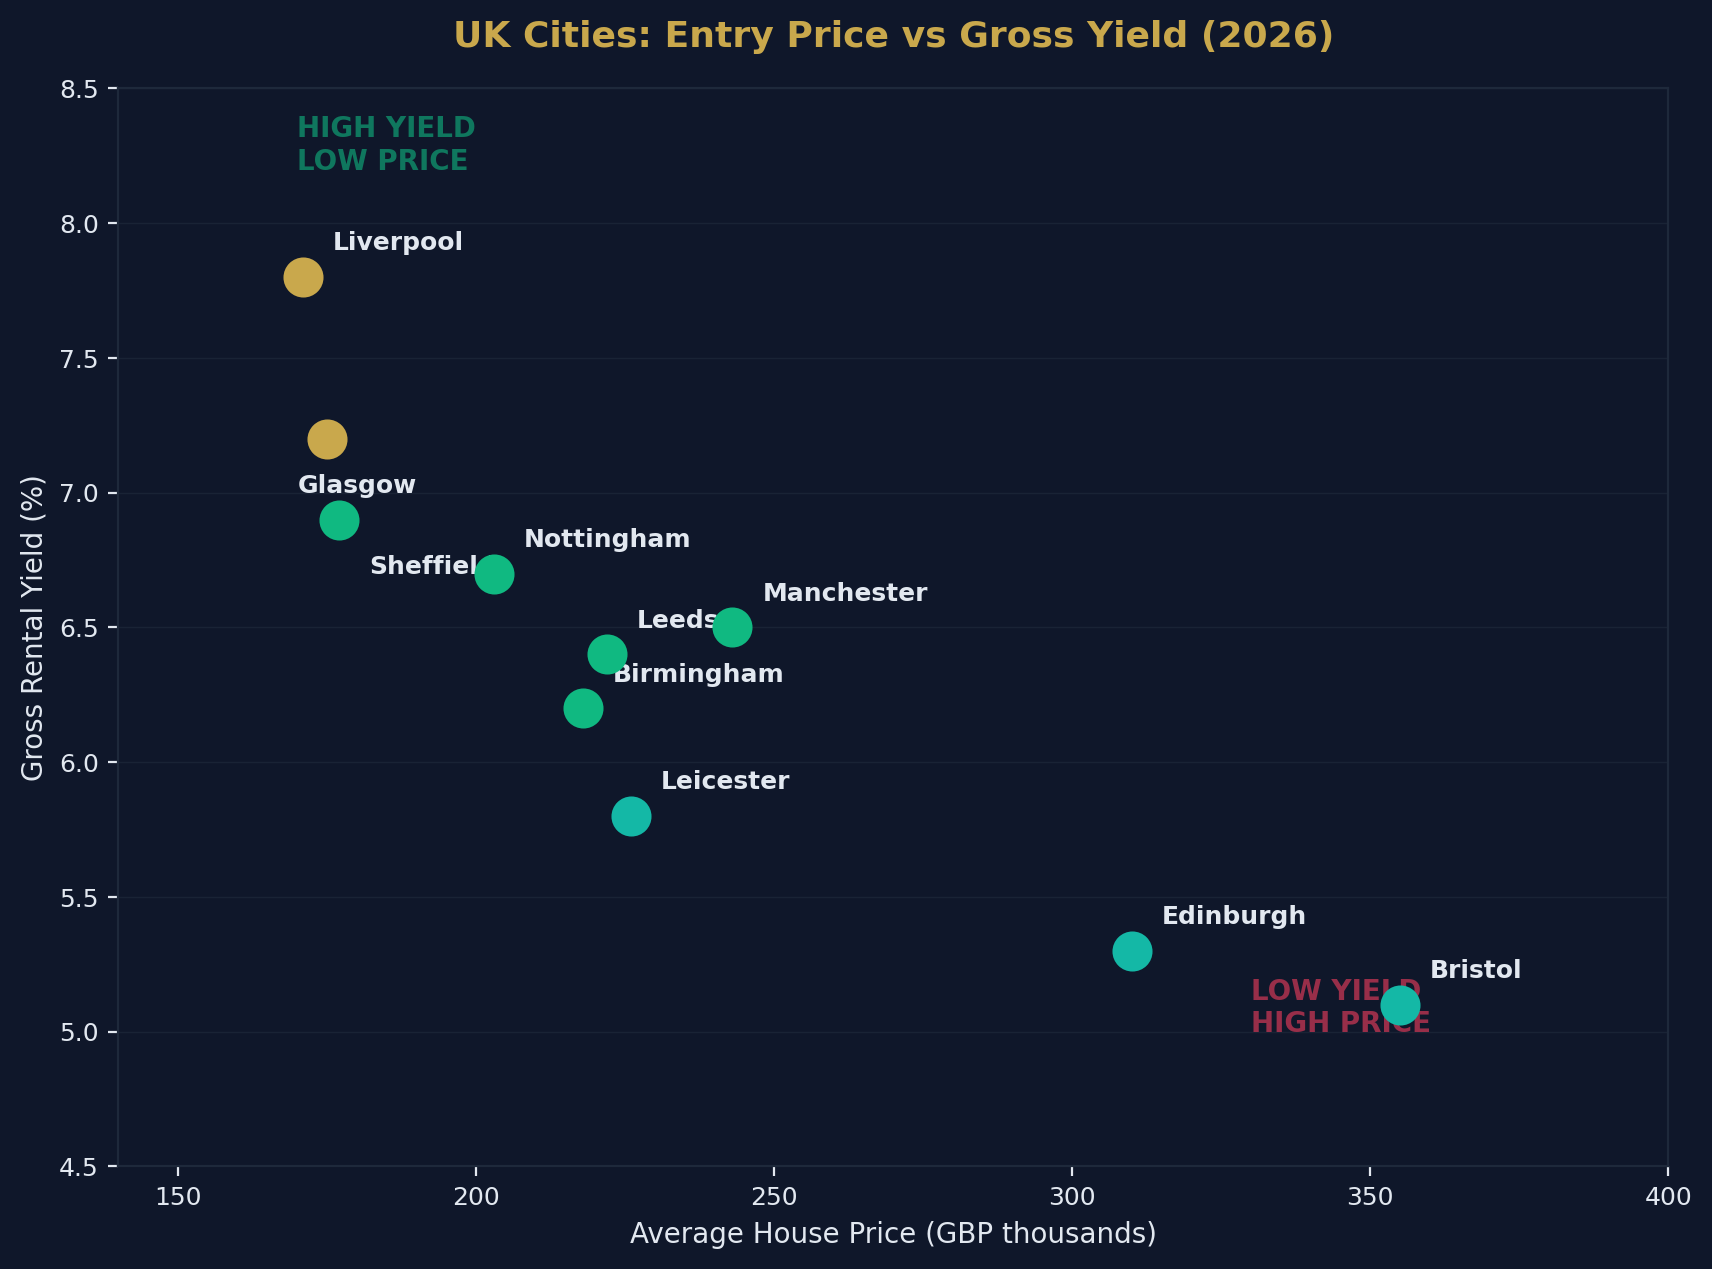
| Average house price | £243,000 |
| Gross rental yield | 6.5% |
| Annual price growth | +3.8% |
| 5-year capital growth | +32% |
| Average time to let | 8 days |
| Key driver | MediaCityUK, HS2 (phase 2), university city |
Why Manchester: The UK's second city for investment. Massive regeneration (Northern Gateway, Victoria North), strong professional tenant demand, and the highest liquidity outside London. Explore Manchester investment →
2. Birmingham
| Metric | Value |
|---|---|
| Average house price | £218,000 |
| Gross rental yield | 6.2% |
| Annual price growth | +2.5% |
| 5-year capital growth | +24% |
| Average time to let | 9 days |
| Key driver | HS2 hub, Commonwealth Games legacy, Smithfield regeneration |
Why Birmingham: The UK's second largest city with the youngest population of any major European city. HS2 connectivity will cut London commute to 49 minutes. Explore Birmingham investment →
3. Leeds
| Metric | Value |
|---|---|
| Average house price | £222,000 |
| Gross rental yield | 6.4% |
| Annual price growth | +4.1% |
| 5-year capital growth | +28% |
| Average time to let | 10 days |
| Key driver | Financial services hub, South Bank regeneration, Channel 4 HQ |
Why Leeds: The fastest-growing economy outside London. South Bank is Europe's largest city-centre regeneration project. Strong demand from young professionals. Explore Leeds investment →
4. Liverpool
| Metric | Value |
|---|---|
| Average house price | £171,000 |
| Gross rental yield | 7.8% |
| Annual price growth | +3.2% |
| 5-year capital growth | +22% |
| Average time to let | 11 days |
| Key driver | Lowest entry price of any major city, strong HMO market, universities |
Why Liverpool: The highest yields of any major UK city. Entry prices under £100k are still achievable in L6/L7. Dominant HMO market with three major universities. Explore Liverpool investment →
5. Glasgow
| Metric | Value |
|---|---|
| Average house price | £175,000 |
| Gross rental yield | 7.2% |
| Annual price growth | +3.5% |
| 5-year capital growth | +26% |
| Average time to let | 12 days |
| Key driver | Lowest major-city prices in the UK, strong rental demand, university city |
Why Glasgow: Scotland's largest city with remarkable value. Different legal framework (Private Residential Tenancy) but strong fundamentals. No Section 24 equivalent in Scotland. Explore Glasgow investment →
6. Bristol
| Metric | Value |
|---|---|
| Average house price | £355,000 |
| Gross rental yield | 5.1% |
| Annual price growth | +1.2% |
| 5-year capital growth | +18% |
| Average time to let | 9 days |
| Key driver | Tech sector, aerospace (Airbus/Rolls-Royce), strong professional demand |
Why Bristol: The South West's economic powerhouse. Higher entry price but premium tenant profile. Strong capital growth trajectory. Explore Bristol investment →
7. Edinburgh
| Metric | Value |
|---|---|
| Average house price | £310,000 |
| Gross rental yield | 5.3% |
| Annual price growth | +2.8% |
| 5-year capital growth | +20% |
| Average time to let | 7 days |
| Key driver | Festival economy, financial services, constrained supply, UNESCO heritage |
Why Edinburgh: Scotland's premium market. Fastest letting times in the UK. Supply-constrained due to geography and heritage rules. Explore Edinburgh investment →
8. Sheffield
| Metric | Value |
|---|---|
| Average house price | £177,000 |
| Gross rental yield | 6.9% |
| Annual price growth | +3.6% |
| 5-year capital growth | +25% |
| Average time to let | 12 days |
| Key driver | Two major universities (65,000+ students), Heart of the City regeneration |
Why Sheffield: Extremely affordable entry point with strong student demand. The Heart of the City II regeneration is transforming the centre.
9. Nottingham
| Metric | Value |
|---|---|
| Average house price | £203,000 |
| Gross rental yield | 6.7% |
| Annual price growth | +2.9% |
| 5-year capital growth | +21% |
| Average time to let | 11 days |
| Key driver | Two universities, East Midlands Hub (HS2), creative quarter |
Why Nottingham: Strong university-driven demand. HS2 Eastern Leg (if confirmed) would be transformative. Excellent value relative to the East Midlands average.
10. Leicester
| Metric | Value |
|---|---|
| Average house price | £226,000 |
| Gross rental yield | 5.8% |
| Annual price growth | +2.4% |
| 5-year capital growth | +19% |
| Average time to let | 13 days |
| Key driver | University city, central location, affordable for Midlands |
Why Leicester: Often overlooked but solid fundamentals. Central location, good connectivity, and a large student population supporting rental demand.
Investment Strategy by Budget
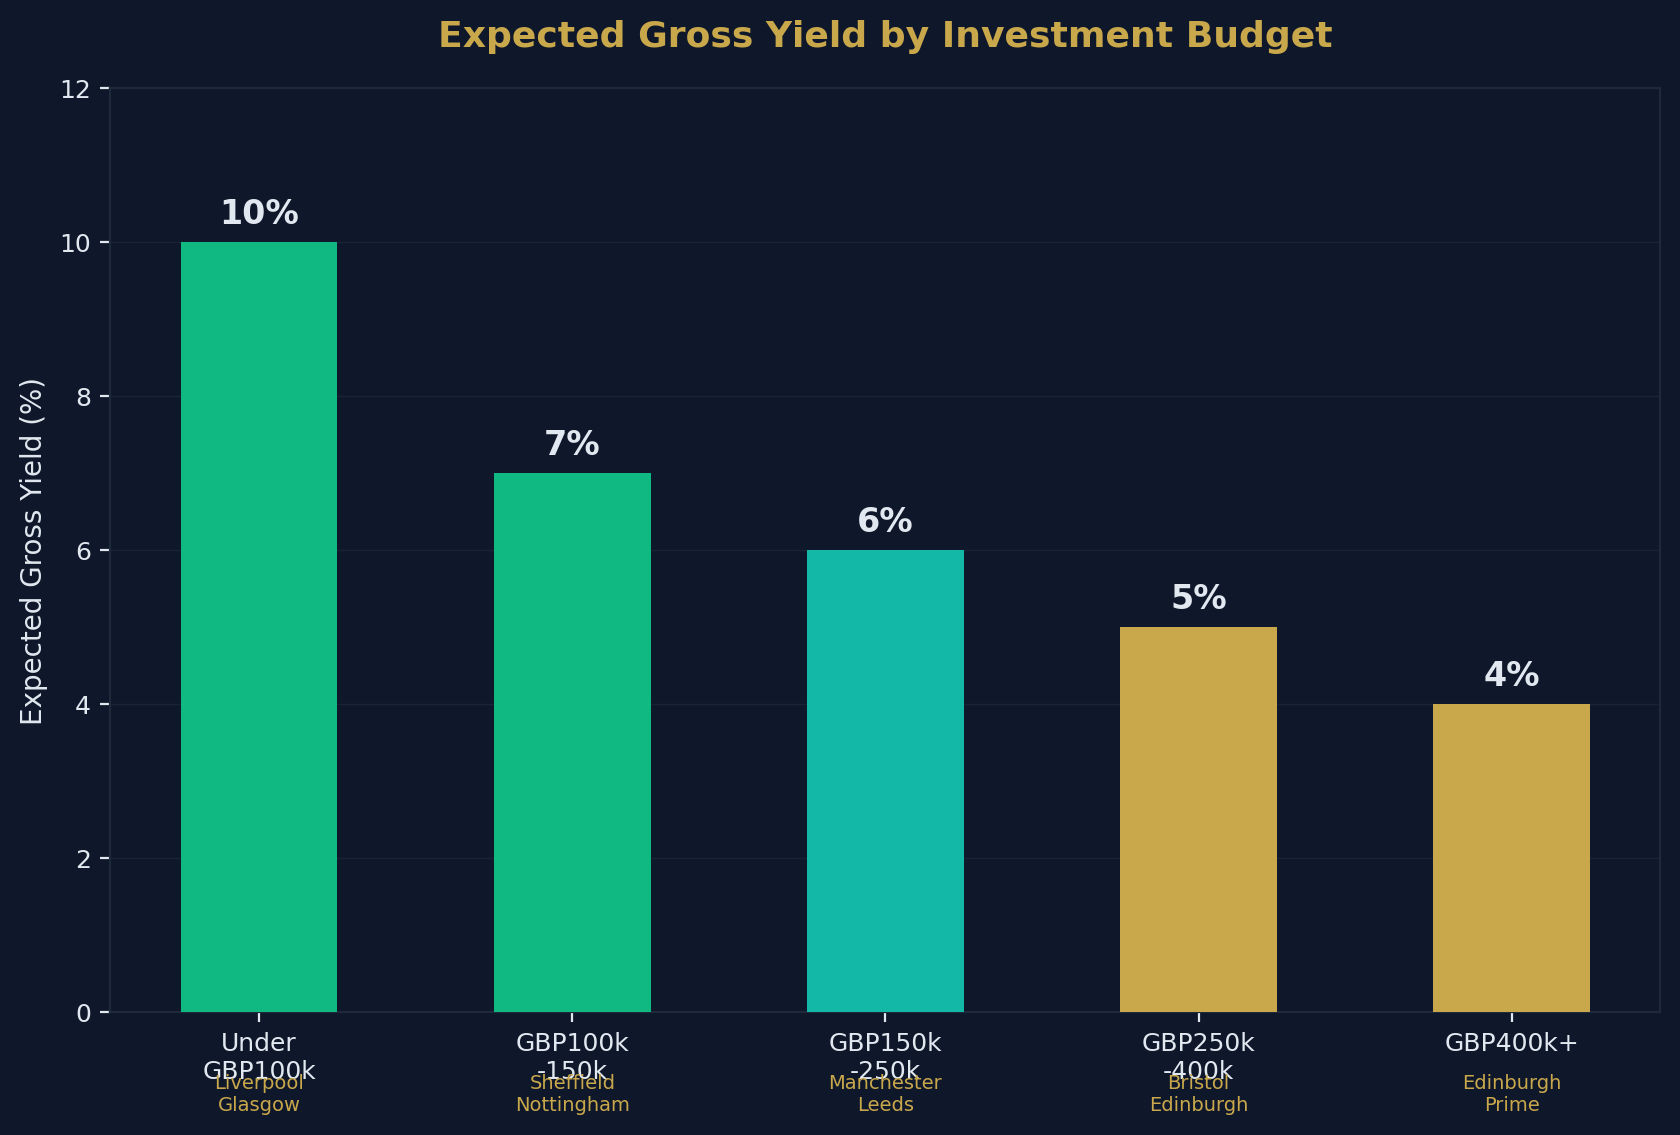
What Can You Buy?
| Budget | Best Cities | Strategy | Expected Yield |
|---|---|---|---|
| Under £100k | Liverpool (L6/L7), Glasgow (East End) | Single let or HMO conversion | 8–12% |
| £100k–£150k | Sheffield, Nottingham, Liverpool, Glasgow | Standard BTL, student let | 6–8% |
| £150k–£250k | Manchester, Leeds, Birmingham, Leicester | Professional let, new-build | 5–7% |
| £250k–£400k | Bristol, Edinburgh, Manchester (city centre) | Premium let, capital growth focus | 4–6% |
| £400k+ | Edinburgh New Town, Bristol Clifton | Premium capital growth | 3–5% |
The Yield vs Growth Trade-Off
| Strategy | Best For | Focus Cities |
|---|---|---|
| High yield (6%+) | Cash flow, mortgage coverage | Liverpool, Glasgow, Sheffield |
| Balanced (5–6%) | Growth + income | Manchester, Leeds, Birmingham |
| Capital growth | Long-term wealth building | Bristol, Edinburgh, Manchester prime |
Key Factors Driving 2026 Performance
Why the North Is Winning
| Factor | Impact |
|---|---|
| Affordability | Average earner can buy in the North; priced out of the South |
| Yield compression | Southern yields squeezed by high prices; Northern yields remain attractive |
| Infrastructure | HS2, Northern Powerhouse Rail, Manchester Airport expansion |
| Employment growth | Tech, financial services, and media relocating northward |
| University demand | 40% of Russell Group universities are in Northern/Midlands cities |
Risks to Watch
| Risk | Affected Cities | Mitigation |
|---|---|---|
| Interest rate rises | All (highly leveraged portfolios) | Stress-test at 7%+ |
| Renters' Rights Act compliance | All (England) | Professional management |
| EPC C deadline (2030) | Older stock (Victorian terraces) | Budget £3–6k per property |
| Oversupply (new-build) | Manchester city centre, Birmingham | Avoid oversaturated postcode areas |
| Stamp duty surcharge (5%) | All | Factor into acquisition model |
How to Choose Your City
Decision Framework
| Question | If Yes → |
|---|---|
| Do you prioritise cash flow? | Liverpool, Glasgow, Sheffield |
| Do you want balanced growth + yield? | Manchester, Leeds, Birmingham |
| Are you a hands-off investor? | Explore managed options → |
| Do you want to invest by budget? | Browse by investment amount → |
| Do you want neighbourhood-level data? | Explore area guides → |
Frequently Asked Questions
Is London still worth investing in?
For yield — generally no. London gross yields of 3.5% rarely cover mortgage costs at current rates. For long-term capital growth (10+ year hold), prime London retains appeal. Most professional investors are allocating northward.
Should I invest near where I live?
Not necessarily. Professional management and limited company structures make remote investing straightforward. Choose cities based on data, not proximity.
How many properties do I need for full-time income?
At average yields of 6% after costs, you need approximately £500,000 in property equity to generate £30,000/year in net rental income. This typically means 3–5 properties in Northern cities.
What about property tax implications?
Stamp duty surcharges (5%), Making Tax Digital, and income tax all vary by structure. Ltd companies are generally more efficient for portfolios of 3+ properties.
How to Cite This Page
Where to Invest in UK Property in 2026: The Data-Driven Guide. Shaded Canvas. Published April 2026. Available at: https://blog.shadedcanvas.co.uk/post/where-to-invest-uk-property-2026
Stop being a landlord. Start being an investor.
Shaded Canvas introduces serious capital to vetted UK property opportunities — targeting 12–16% net returns.
Start Investing →

